Calibre Mining: Debt Free Gold Producer Expands Gold Mineralization at Limon Mining Complex and Reports Strong Q3 Operating Results
During this past week, one of the companies we follow closely, Calibre Mining Corp. (TSX:CXB)(OTCQX:CXBMF), delivered two positive results: they found more gold, and production remained strong and steady.
But first, let’s quickly review the highlights of a press release dated September 29, 2021, which outlined recent exploration successes.
The ongoing exploration program has two primary goals: expand gold mineralization that can be accessed by existing mine workings, including the open pits, and explore for and delineate new gold deposits.
Here’s the plan map:
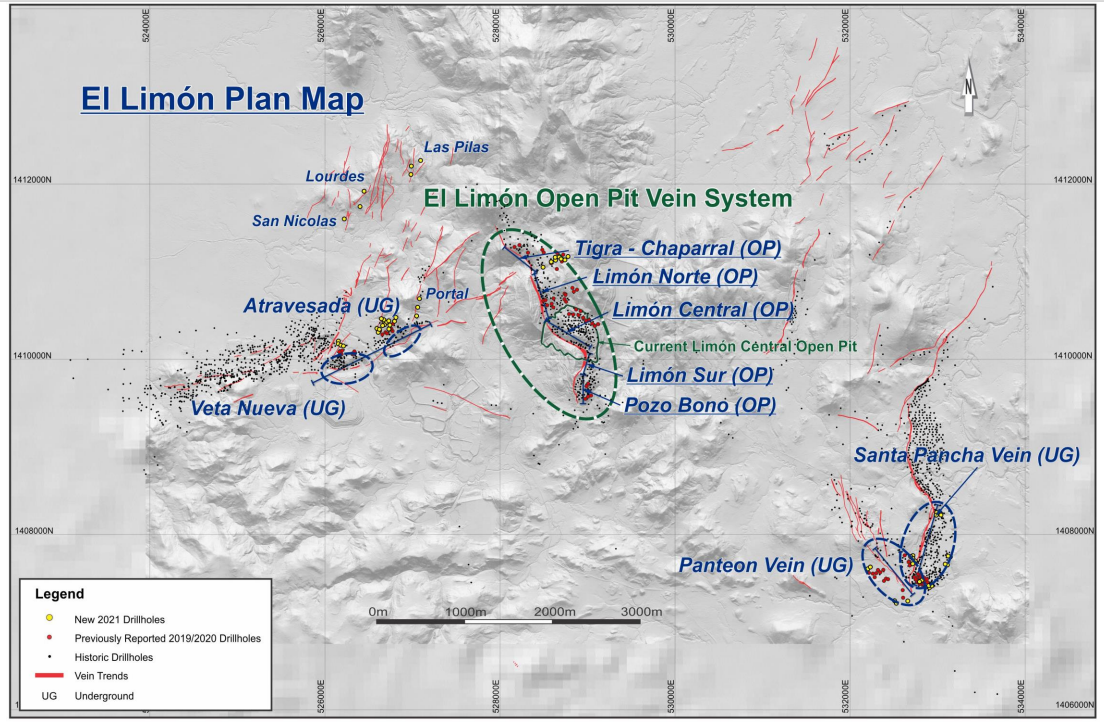
More Gold: Exploration
Resource expansion drilling at the Atravesada deposit focused on the central ore shoot’s projected down plunge extension.
Multiple high-grade gold intercepts were encountered. These include: 9.02 g/t Au over 3.0 m; 6.39 g/t Au over 6.2 m, and 4.27 g/t over 4.2 m.
All reported intercepts are Estimated True Width.
Drilling at Tigra further confirmed the potential to outline additional high-grade resources along the main ore shoot, as it extends below the lower limit of the open pit probable reserve. This reserve contains 87,000 ounces of gold.
Additionally, there are 50,000 ounces of gold below the open pit outlined in the inferred category.
Initial drilling at the Portal vein has delivered encouraging near-surface results: 5.75 g/t Au over 2.3 m at 115 m depth; 2.77 g/t Au over 4.1 m at 67 m depth, and 1.68 g/t Au over 18.6 m at 40 m depth.
The last intercept noted is of particular interest as it demonstrates that gold mineralization can occur over a substantial width. We look forward to seeing more drill results from this promising new area.
Additional drilling at Panteon and Santa Pancha 1 show drill intercepts consistent with the high-grade shoots that are continuing to develop at each deposit.
Strong and Steady: Production
CXB continued to produce gold in line with their guidance. In Q3, gold output was 44,479. The company expects that Q4 will be the strongest operating quarter of 2021 and that the Limon Gold Mine Complex is on track to deliver at the high end of guidance (170,000 – 180,000oz).
CXB is currently generating significant free cash flow ($6.6 million added to cash in Q3) while simultaneously self-funding investment in exploration and mine development. This growth strategy is the overall result of the successful implementation of the “Hub-and-Spoke” operating model. The company has $72.9 million in cash, no debt, and remains unhedged.
Going forward, management intends to explore/develop/mine new deposits without delay to take full advantage of the current gold price and the leverage of having 50% surplus capacity available at the Libertad mill.
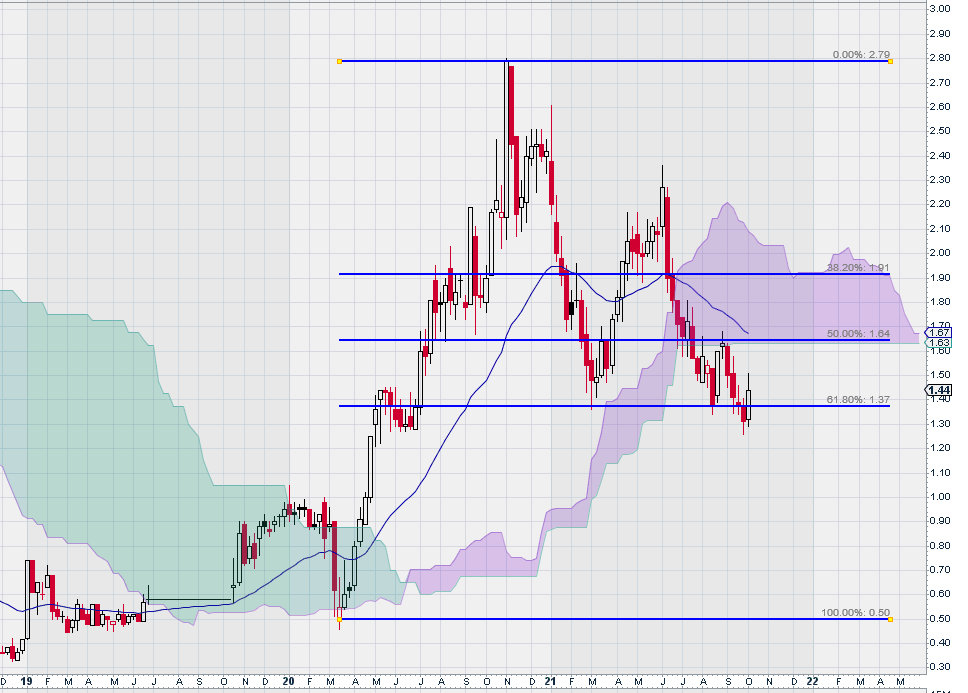
Technical Analysis of Weekly Stock Chart
CXB is currently at an important level – it is clinging to the last remaining Fibonacci support level using the March 2020 “COVID low” and the subsequent high in November 2020. This weekly chart is in direct contrast to progress made by the company over the past two years.
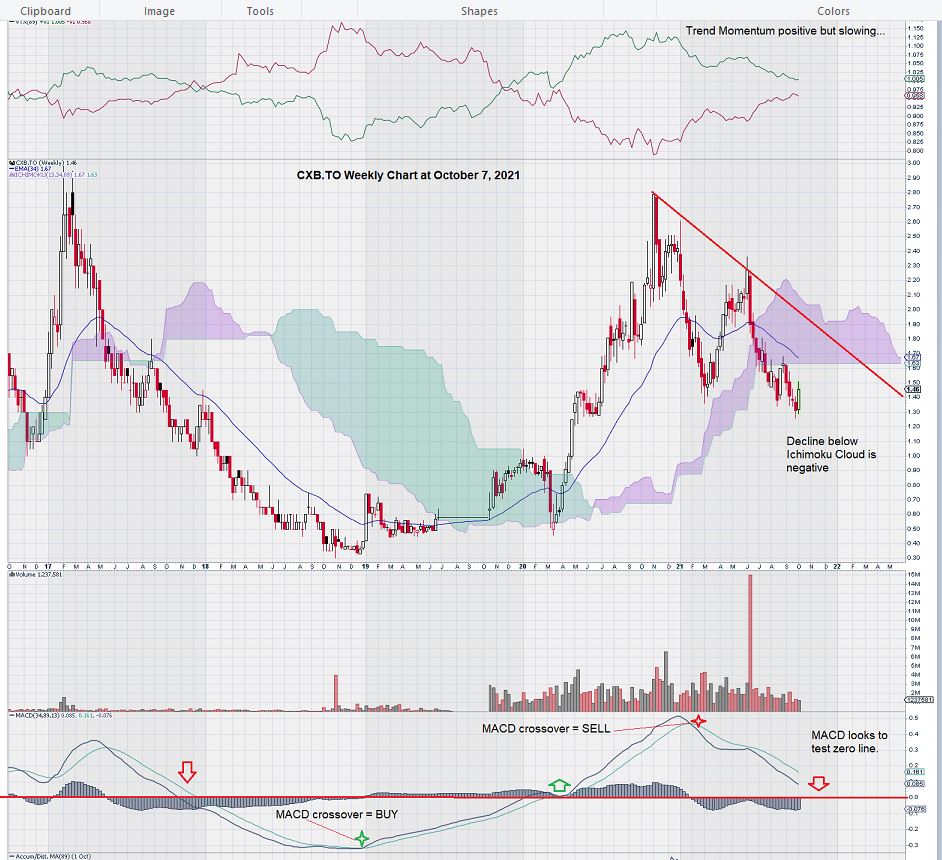
Taking a longer look at the weekly chart, we can see that there is no assurance that the current share price level will result in the start of a price recovery. MACD on our trend settings remains intact for a test of the zero line. Trend Momentum has slowed and, although still positive, could become negative soon. The price chart has fallen below the Ichimoku Cloud, and this is a clear warning sign that further weakness could soon occur.
However, the weekly chart seems to have good “predictive power” – especially if one observes how MACD has previously behaved.
We can see that once the MACD signal line (the black line) declines below the trigger line (the “thinner” blue line), as is noted in May 2017 and also in February 2021, price declined. In the second instance, there was a brief counter-rally that lasted about 4 months, but then price continued its descent. A zero-line cross-over by MACD, as expected, denoted even further weakness.
Once the signal line for MACD re-crossed over the signal line (January 2019) it signaled the start of a long rally the helped propel CXB back up to its previous high in the $2.80 level.
The trading pattern we see for CXB is fairly typical and somewhat predictable. The combined use of Trend Momentum, MACD, and Ichimoku Clouds is a sound way to get an impression of how something trades.
The Golden Bonus: Eastern Borosi Project
Let’s take a moment and re-cap where we are. CXB has delivered strong financial results in Q3 and is anticipating an even stronger performance in Q4. Every indication is that the current deposits being mined can be expanded. The mining is going well, and the mill is running smoothly.
Yet, despite all of the strong fundamental progress, the technical picture for CXB is weak. So, what to do?
There is an answer, and luckily, it’s one that favors CXB.
This brings us to the recent drill highlights of the Eastern Borosi Project (EBP). Drilling has encountered 25.07 g/t Au over 9.7 m; 39.21 g/t Au over 3.1 m; 24.85 g/t Au over 3.9 m and 33.64 g/t Au over 3.2 m.
Darren Hall, President & CEO for CXB, had these comments that relate to the EBP:
“Exciting progress continues at the Eastern Borosi Project, with drilling returning some of the best near-surface intercepts to date, including 25.07 g/t gold over 9.7 metres. With technical and environmental studies ongoing, we are confident that the EBP will be our next high return mining spoke, replicating the success at Pavon Norte.”
The Eastern Borosi Project is that “something extra” that can make all the difference. The very high-grade material can be viewed as a kind of “operations insurance.”
For example, we know by our analysis of the weekly charts for gold and gold stocks (S & P TSX Global Gold Index) that a retracement is currently underway. Should this last longer than expected, the EBP will allow CXB to ensure that it maintains a strong operating profile without having to be concerned about lower or marginal grades. In other words, CXB can withstand a “lower for longer” environment for gold, should it occur.
Summary & Wrap-Up
“Timing is everything” is a well-worn catchphrase.
But what does it really mean?
And what does it mean when we apply it to CXB today?
CXB has made a significant “discovery” at the Eastern Borosi Project that could not come at a better time for CXB shareholders.
They are already familiar with the company and understand how exploration success represents production leverage due to excess mill capacity.
Gold is backpedaling, liquidity is drying up a bit in some resource stocks, and the general environment for gold and gold stocks appears tarnished.
However, the opportunity for the not so faint-at-heart investors is strong. Those who can look at the 5-year weekly chart for CXB and see that the technical signals show that we are perhaps a little more than half-way to another turnaround of what could be another long, sustained rally to the upside.
One thing is quite clear from the CXB weekly chart: the stock is bi-directional. When there is “wind in the sails,” it performs very well. Unfortunately, the opposite is also true; sagging momentum is dragging the stock lower.
Most of the time, it would be sensible to avoid trying to “catch a falling knife,” but this is not most of the time – this is something quite different. Further favorable high-grade results at EBP will, on their own, bring the decline to an end.
The “timing is everything” model suggests that all it will take is broad recognition by the market that CXB is getting much stronger despite the weakness we are seeing across the gold sector.
– John Top, the technical trader
Disclosure: We own shares, options, and CXB is an advertiser.