Today our focus is on the 5-year weekly chart for the Dow Jones Industrial Average (DJIA).
Let’s get straight to it. Here is the chart:
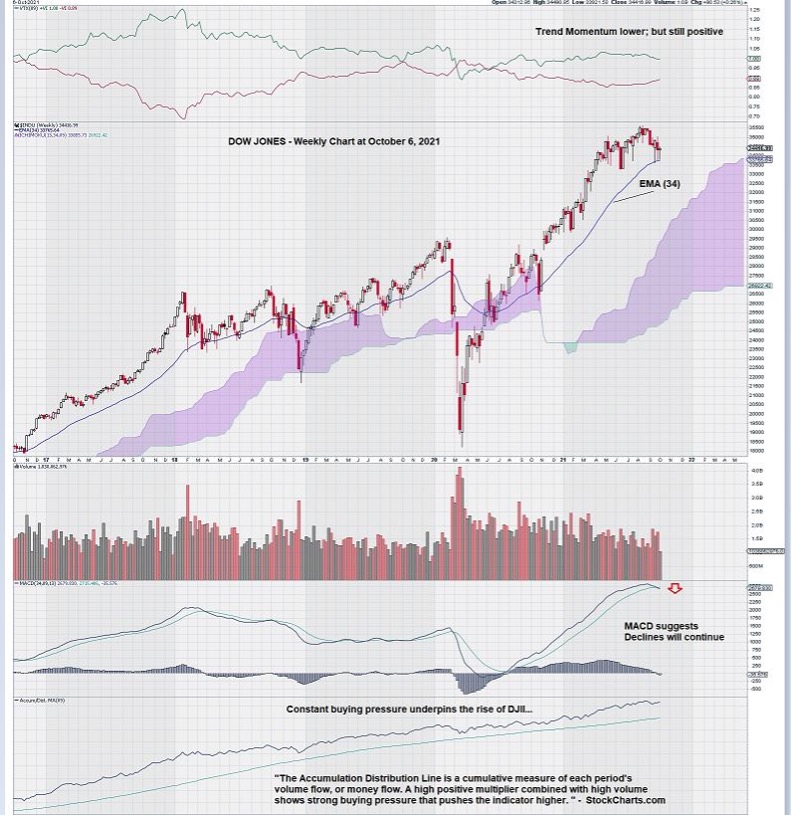
The weekly chart for DJIA shows MACD, on our Fibonacci-based trend settings, just starting to “roll over.” Notice that MACD has been in a very strong position since the signal line crossed over the trigger line – late summer of 2020.
The DJIA has shown consistent technical strength up until very recently.
We can see this very plainly by noting that both the signal line and the trigger line have been rising in unison – with good separation between them.
The 34-week Exponential Moving Average, EMA (34), has underpinned support for the DJIA weekly chart. Any small retracement has generally been met with resistance at this level. Along the entire 5-year period we are looking at, the DJIA has declined below this level only twice: once in late 2018 and again in 2020 due to the “COVID bump.”
Note that we define “decline” by at least two consecutive closes below EMA (34), with the second consecutive close on a stronger candle than the first; more volume, lower price, gap down, or some other “series of technical signs that point to further weakness.”
The Accumulation/Distribution Line has tracked the decade-long rise of the DJIA. It shows a steady rise over the past five years and the five years before that.
The way that this indicator is constructed means that most of the time, the weekly close was at or near its high end of the range for the week. There was never enough “sustained negative sentiment” to push the Accum/Dist Line below the EMA (89) week trigger line.
Finally, we see that there is little chance of the DJIA weekly chart penetrating the lower bound of its Ichimoku Cloud, barring a catastrophic decline of almost 10,000. Again, this seems very unlikely, even though MACD is starting to show a negative bias.
Summary & Wrap-Up
The DJIA weekly chart looks lower. MACD is weakening, and Trend Momentum has been stronger in the past.
Supply change concerns have become a reality. The global economic engine does not like to have “fuel problems,” yet that is the situation that exists today.
News stories about empty containers making their way back across the ocean are signs that global trade is not functioning as it should. The economies of many countries are interlinked through trade. As a result, problems with trade easily infect other sectors.
As we all know, the stock market is a leading indicator.
It may be time to take some profits, enjoy Christmas, and make some decisions next year, once more economic certainty exists.
Our longer-term “trend” chart settings will be of use in helping to “time” next year’s stock market, especially if there is a significant decline.
– John Top, the technical trader