
A Golden Dilemma: Gold Up – Gold Stocks Down
Lets telescope in on the last few days of trading for both gold and gold stocks to see how gold vs gold stocks have performed. We will use the S & P TSX Global Gold Index and the VanEck Vectors GDX gold ETF as proxies for investment in gold stocks.
Our regular readers know that our break-out target for gold was in the $1350/$1375 range based on Fibonacci retracement studies. (See Waiting for the Golden Moment: Time to Buy Gold Stocks? October 28, 2019).
So what has gold done in the past few days?
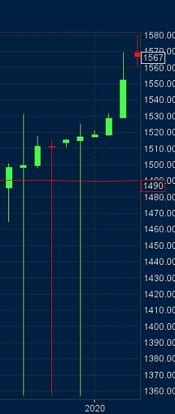
Over the past 10 days, gold has risen from below $1490 to about $1570. It is also instructive to note that the gold price has now risen above its previous weekly high close of just over $1540. Volume was positive 9 of the last 10 days.
In the meantime, how have gold stocks performed?
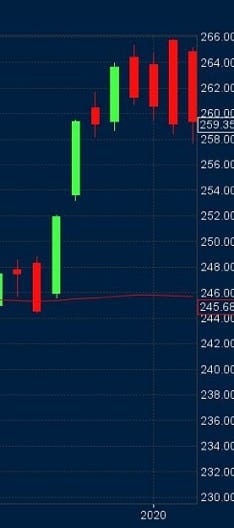
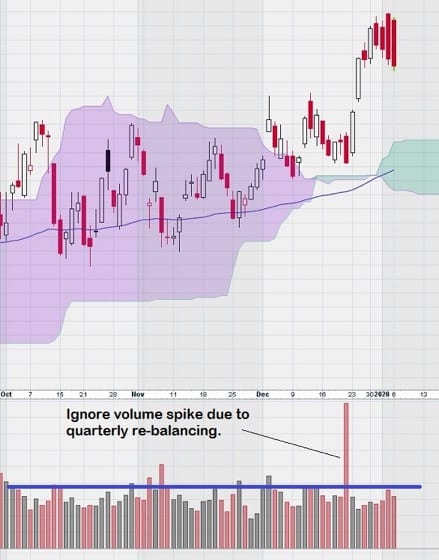
Gold stocks have seen a modest increase from 246 to 266, a better rise percentage-wise but without a significant increase in volume after excluding the large volume spike on December 20, 2019. Recall that there is a “rebalancing” that occurs on the 3rd Friday at the end of each calendar quarter.
And now, we take a closer look at the VanEck Vector ETF – GDX. Our idea is that perhaps the passive investor interest is more noticeable in a gold ETF than in the large collection of gold stocks that make up the gold index.
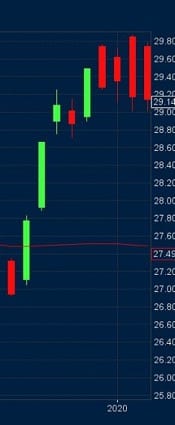
Here we do notice that during that time, there were 4 “up days” shown on this chart by the green candles. A closer look reveals that volume averaged around 60 million shares per day; not high volume but steady volume.
What do these three charts tell us?
Precious metal investors are drawn to owning physical gold. It is truly impressive to see 9 of 10 positive volume days for gold.
In the meantime, even though gold stocks may have performed better, the support for gold stocks appears weak, as demonstrated by the lack of volume.
In summary, this is the sort of market action that “unbalances” the retail investor. It is entirely sensible, logical, and expected that gold stocks should rise and fall with gold. Here we see strong, consistent demand for gold matched with decisive selling of gold stocks; particularly in the past 4 days. The GDX ETF trading seems somewhat neutral. We can not make the case that investors prefer passive over active investment when it comes to gold stocks. The charts for the S&P TSX Global Gold Index and GDX appear similar.
In July 2016, the S & P TSX Gold Index rose to the 280 overhead resistance level but could not move past it. Last year, in July 2019 the index rose to 270 and then fell back. At the start of 2020. the index is hovering at the 260 level.
Gold is doing its part – investors may need to see another “round number” $1600/$1700 or beyond to reignite their obvious lagging interest in gold stocks.
Will the “Ides of March” give way to the “Joys of July”?
-John Top