Patiently Waiting on A Solid Signal for Copper – Does Anyone Care?
(Educational Segment 006)
Regular readers of our charting Educational Segments have already learned that we are patient – very, very patient. And it pays to wait. After all, on the longer-term trend settings that we use, we have seen enough examples of how long it takes for a trend reversal to emerge.
Recall our latest Educational Segment 005, where the key break-out level for the S & P TSX Global Gold Index was identified in 2012. It was tested in 2016 and failed. After four years, the index finally broke above the key 280-level and gave the “gold standard buy signal” for gold stocks.
Not only that, but in some of our previous Educational Segments, readers will also note that we like to see additional confirmation – if it is available. In other words, we don’t mind being a bit “late,” but we need to feel that we are giving ourselves the best possible opportunity to be right.
A good example of this is how we “need” to see a better weekly candlestick on the second weekly break out candle that closes above a pre-defined level. That level could be a Fibonacci Retracement level, an internal support/resistance level, or a level defined by a particular candlestick such as an Evening Star or a Separating Line.
Today, we will look at the weekly chart for copper and examine the True Strength Index (TSI). Before we get started, let’s brush up on what the TSI is used for and why it is particularly useful when analyzing the longer-term weekly chart for copper.
TSI is essentially a double smoothed momentum oscillator that has previously captured both positive and negative changes for copper that yielded two sets of solid trade signals. Much more detail on exactly how the TSI oscillator is calculated is provided by the link below:
https://school.stockcharts.com/doku.php?id=technical_indicators:true_strength_index
The reason why TSI is so effective for copper is based entirely on our original signal matrix: we use Fibonacci numbers instead of the standard values offered by various charting services. In other words, we have “customized” the chart settings to reflect our belief that Fibonacci numbers have proven themselves superior to us in their many applications of various oscillators and indicators that we have used over many years.
Let’s take a look at the 14-year weekly chart for copper:
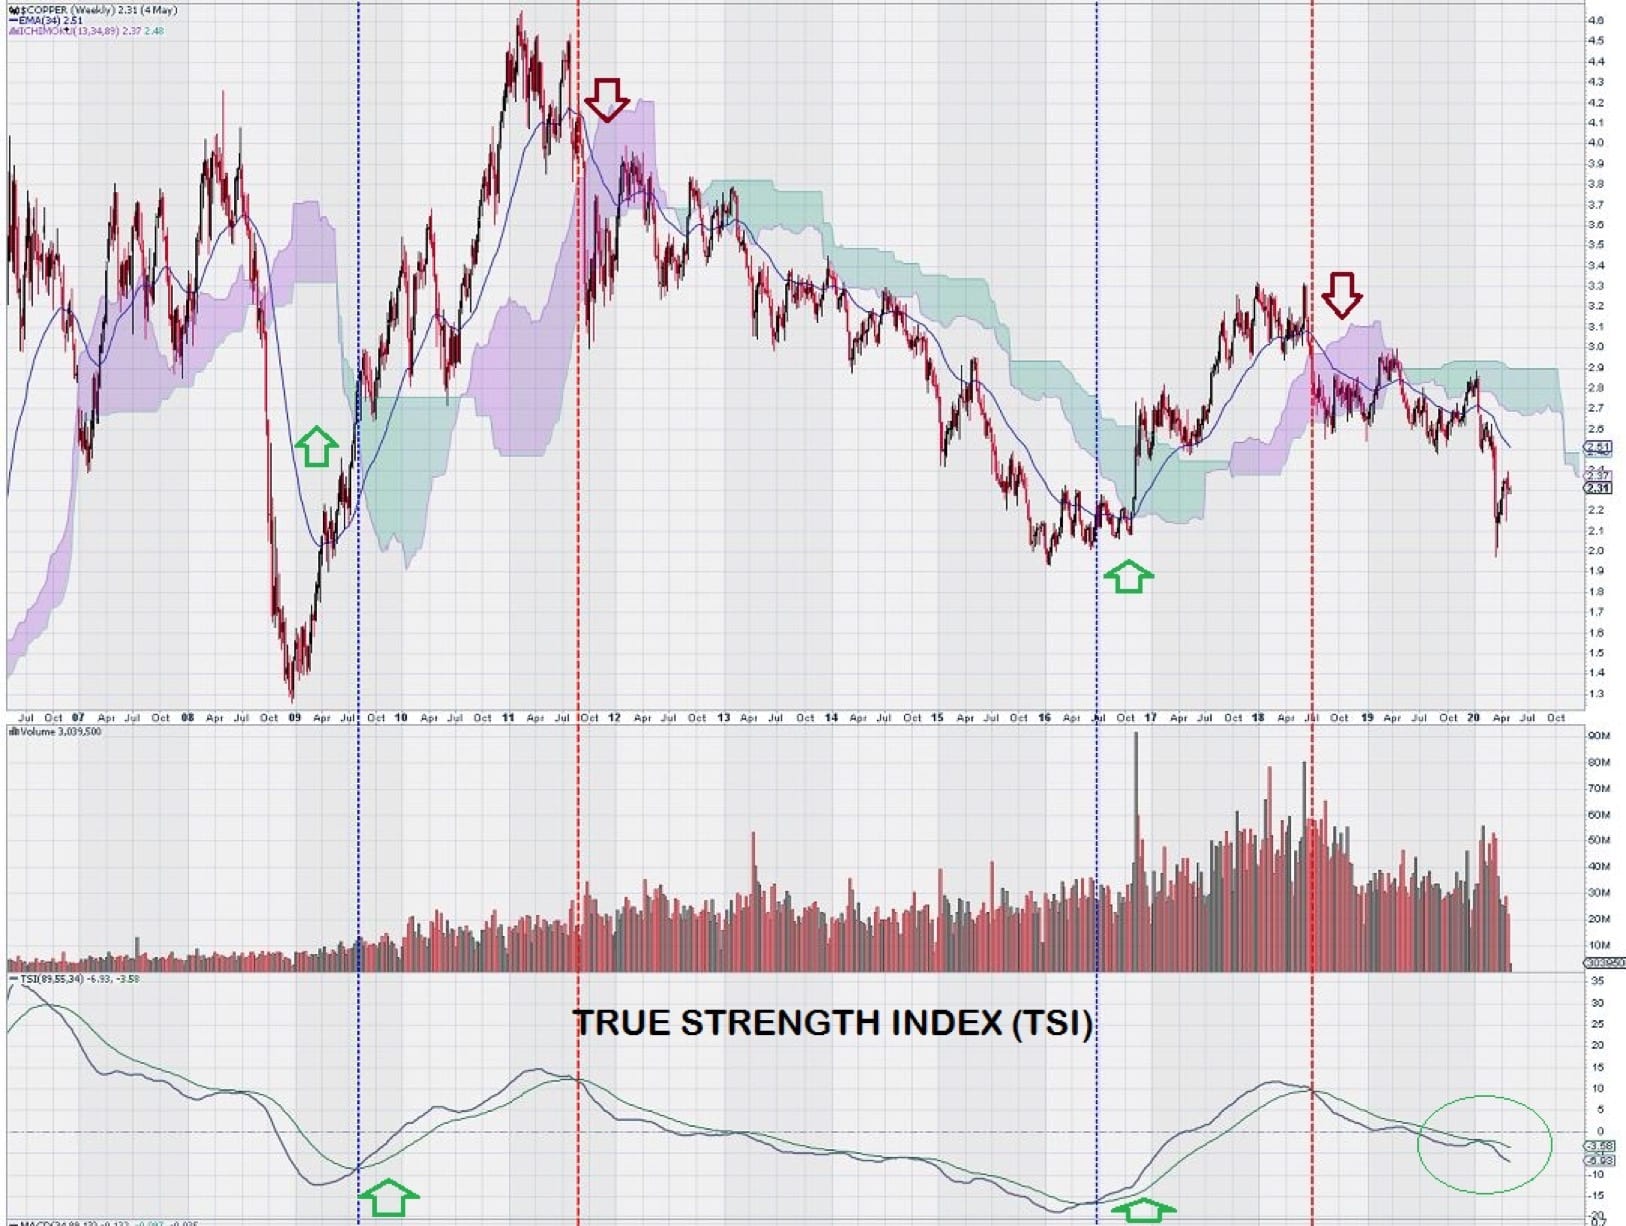
This chart clearly shows that TSI lives up to its reputation of being able to filter out the “noise” that usually accompanies all charts. The green arrows mark solid trade entry points and are keyed to crossovers of the trigger line over the signal line, as shown. These two crossovers occurred in 2009 and 2016.
Periods of price strength are seen afterward.
Correspondingly, the red arrows, which occur when both the signal line and the trigger line are above the zero line, show when the signal line crosses over below the trigger line. Periods of price weakness follow.
Where are we today?
Today we are doing what we seem to do best: Patiently Waiting. The light green circle on the TSI at the right-hand side of the chart in the lower section shows that the signal line is below the trigger line and is unlikely to crossover soon.
So what to do?
When time is your friend, it is your best friend.
We can use this time to come to better understand where there might be opportunities in stocks that will benefit when the buy signal for copper is noted. We can start by a standard analysis of senior, mid-cap, and junior companies to get a preliminary sense of valuation. From there, we can start to isolate those companies on which we will direct our investment focus.
The outline for when and how to invest in copper stocks can be used as a “template” for investors to develop their own investment strategy – one that is based on logic, timing, and a good mix of both technical and fundamental analysis.
In summary, when the time comes, we will know what we want to buy and when we want to buy it. And isn’t that the first step in becoming a successful investor?