
Does The Baltic Dry Index Explain Copper’s Gain?
We are starting to hear more and more financial news reporters talk about the Baltic Dry Index. But what does that mean for resource investors?
First, a quick refresher. Here is an excellent summary of what the Baltic Dry Index (BDI) is and why it is a useful economic indicator.
“The Baltic Dry Index (BDI) is an assessment of the average price to ship raw materials (such as coal, iron ore, cement, and grains) on a number of shipping routes (about 50) and by ship size. Thus, it is an indicator of the cost paid to ship raw materials on global markets and an important component of input costs. The index is considered a leading indicator (forward-looking) of economic activity since it involves events taking place at the earlier stages of global commodity chains (the procurement and transformation of raw materials). A high BDI index indicates a tight shipping supply due to high demand and is likely to create inflationary pressures along the supply chain. A sudden and sharp decline of the BDI is likely to foretell a recession since producers have substantially curtailed their demand leaving shippers to substantially reduce their rates in an attempt to attract cargo. Like all market indexes, the BDI is constantly changing, reflecting its price discovery mechanism.”
The Baltic Dry Index is relied upon by economists, especially ones responsible for providing data to central bankers. This daily survey follows raw materials as they move around the globe from natural resource-producing countries to countries with a strong manufacturing component to their GDP. Think about how Canada ships its raw materials such as coal, copper concentrates, and sulphur to Japan and China.
Now let’s take a look at the long-term weekly chart for the BDI:
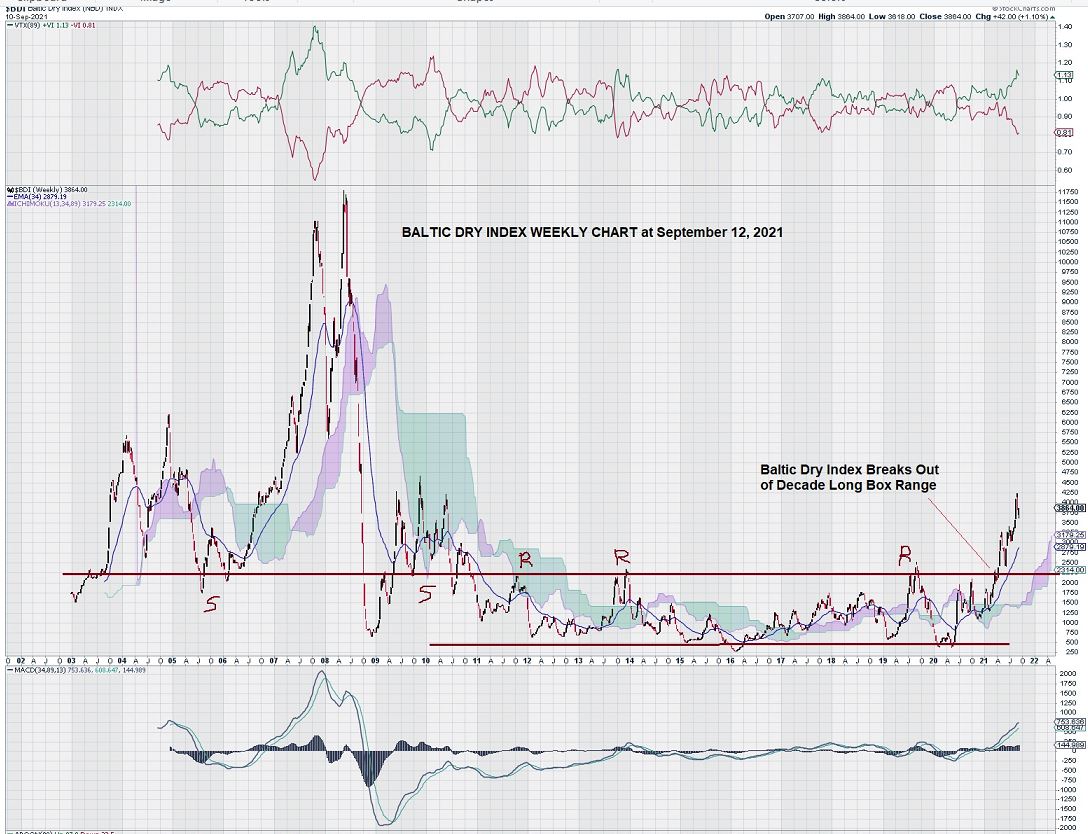
The weekly chart for BDI tells its own story.
We can clearly see that something different is firmly underway after a decade of limited movement due to a defined box range trading pattern.
So, what is causing BDI to reach decade-long new high levels?
Usually, we could provide a straightforward answer to this question. Instead, the chart pattern we see is a mirror image of the surging global demand for raw materials we witnessed in the mid-2000s. Is there another commodities “boom” just around the corner? Has it already started?
The “correct” answer is: “It is still too early to tell.”
Let me explain why.
The global economy has been under a temporary siege brought on by COVID-19. The after-shocks of COVID are that global supply chains have seen and continue to see wide-scale interruptions. This explains, in part, why the Baltic Dry Index has been on quite the tear recently.
Manufacturers can not fill orders if they are short of raw materials. They simply cannot manufacture enough finished goods to meet demand.
In response to this critical problem, they are placing larger and larger orders to ensure that they can meet a large inventory of backorders. Additionally, there is a certainty that once COVID restrictions are finally lifted, consumers will once again open their wallets, and a mini-buying frenzy may mark the “official end” of the virus – from an economic perspective.
The weekly chart for BDI paints a compelling picture of another multi-year commodities boom. In particular, when we look at MACD we see that it has crossed the zero and is in a strong uptrend with the signal line above the zero and both lines with a positive slope.
Now we will see what the weekly chart for copper tells us.
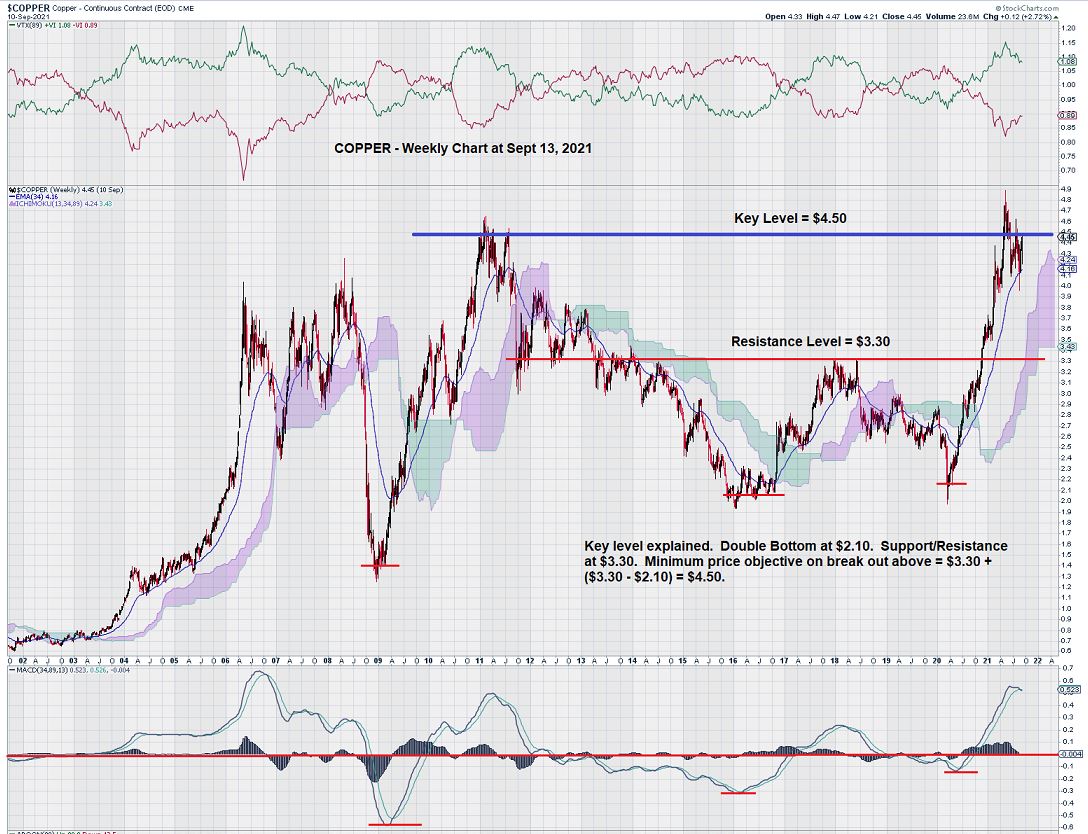
The weekly chart for copper had a solid technical foundation leading up to its break out above the $3.30 level at the end of 2020. This can be seen by the rising bottoms in trend MACD. Also, the double-bottom pattern for copper is noted at the $2.10 level in 2016 and 2020.
The double bottom pattern and subsequent break out above overhead resistance at $3.30 gave a minimum price objective of $4.50, which was achieved.
Now we are starting to see trend momentum weaken a bit, and, more importantly, it appears likely that trend MACD will soon show that the signal line is below the trigger line. When this occurs, a retracement will be underway. Note that for most of 2020 and 2021, until the past few weeks, copper has been on an unrelenting climb higher.
The copper price has retreated by about 10% from its recent highs. However, further declines in the copper price to Fibonacci levels of $3.80/$3.45/$3.10 would not diminish the strength of the current rally from $2.10 to $4.50.
At this point, we must talk about how to reconcile the weekly chart for copper with the weekly chart for the Baltic Dry Index.
The BDI weekly chart shows a strong, decisive move above the 2300-level. It follows a decade-long consolidation.
So, when we think about the weekly chart for copper, in this context, it is easy to buy into the idea that copper had to play “catch up” if it were to track BDI, as one would expect. This is exactly what we see in the weekly chart for copper in the move from the low of $2.10 to the high of $4.50.
What is next for copper?
The copper chart will continue to respond to a slow and somewhat erratic re-awakening of the global economy. Good news about manufacturing inventory shortages, backorders, and improving consumer demand must be counterbalanced with negative worries about the impact of future COVID variants, continued supply chain disruptions, and even the very odd situation of labor shortages in the face of rising unemployment. Some governments have made it more “profitable” to stay home rather than to go to work.
From a technical perspective in terms of time and price, it would not be unusual for copper to slide back and continue to consolidate its recent gains.
Summary and Wrap-Up
The Baltic Dry Index weekly chart shows several strong technical indications that it will continue to rise. This is positive copper and for other commodities.
Technical confirmation that copper will make yet another rally to, and perhaps through, the $4.50 level may be contingent on a pause, followed by a strong rally. This future rally can come once the nagging fears of the COVID virus are finally put to rest.
Going forward, our expectation would be to see the copper chart reverse by having the MACD signal line go below its trigger line and then rise back above it. This turn-around can occur with both lines above the zero.
This will put the copper chart back on a solid technical path to track the Baltic Dry Index as it continues to reflect a growing and sustainable confidence in the world’s economy.
– John Top, the technical trader