Copper Chart Makes Powerful Move Up to Test a Key Breakout Level: Now What?
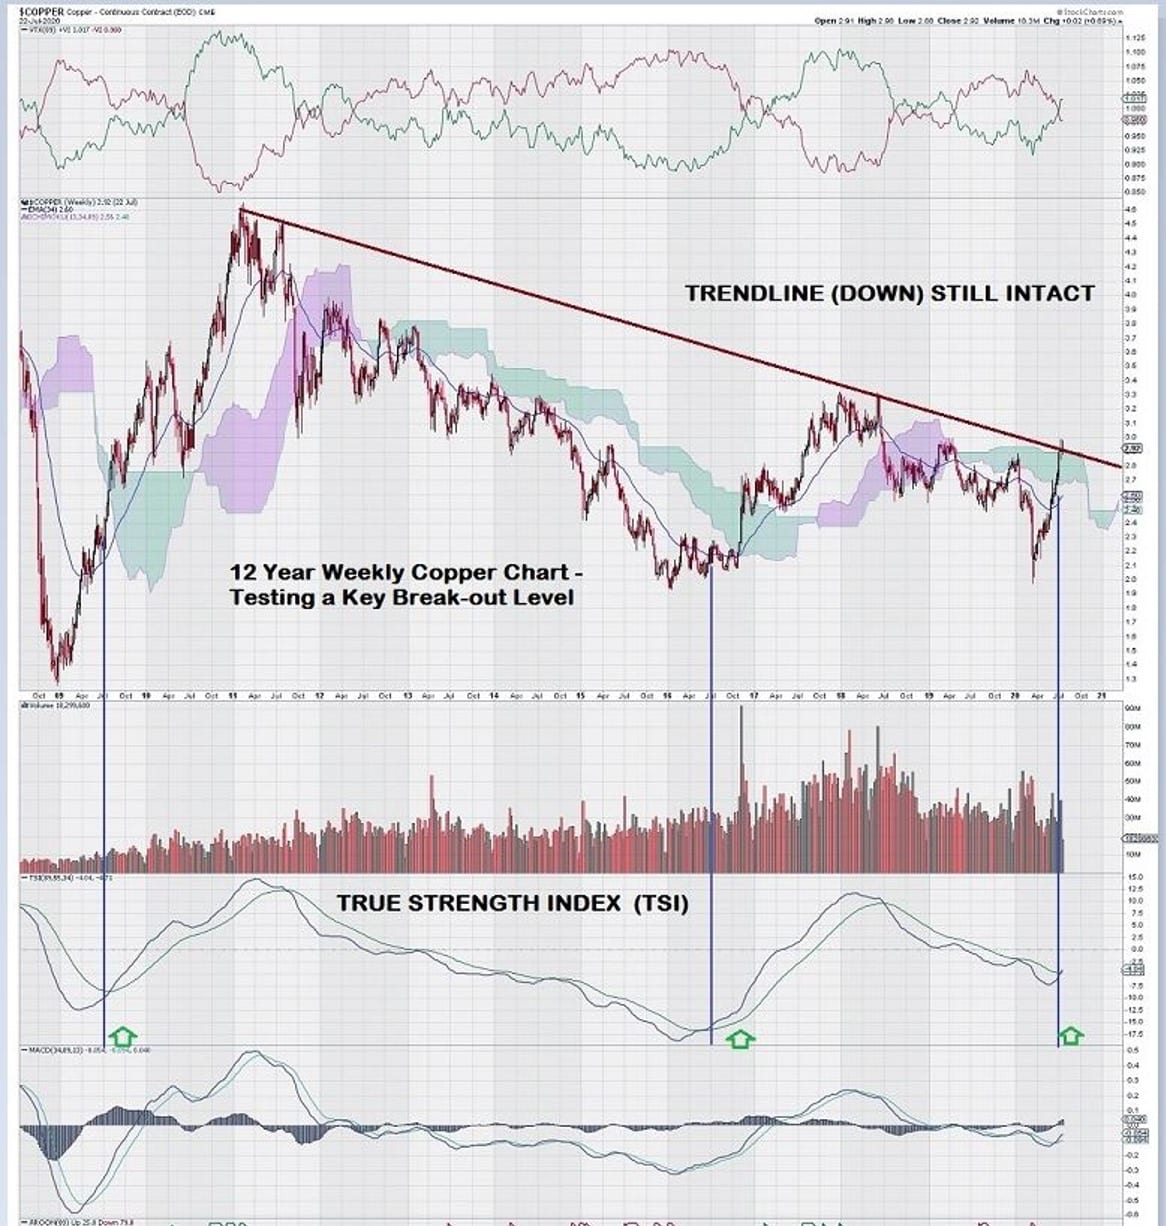
A few months ago, on May 10th, we presented a long term weekly chart for copper that featured two strong buy signals based on TSI, the True Strength Indicator. Both times, after the TSI crossover signal was noted, copper prices rallied, and there was ample “room” to make a trade. Notably, there was room in terms of time, meaning that this was not a case where if you missed the signal, you missed the trade. In the first instance, copper continued to rise for two years after the signal, and in the second instance, it rose for over a year and a half.
Based on this chart, our premise was clearly defined: sit back and wait for a third signal to appear. Sounds pretty simple, doesn’t it?
The chart had a clear direction – down. Trend momentum, MACD, and TSI all pointed to continued lower prices. For a quick refresher, take a few minutes and re-read “Patiently Waiting for A Solid Signal For Copper – Does Anyone Care?”
Well, apparently someone did care. That someone was Mr. Market! Shortly afterward, copper staged a robust and persistent rally back to the current down trend line.
Not only that, but Trend Momentum has also turned positive and TSI, the signal that we were well prepared to wait for, is just now starting to show positive signs. Why is this important? Let’s have another close look at the chart to see if we can make some observations to help us with our trading strategy.
Although it is hard to see the settings used to construct this chart, it is the settings that give us an additional layer of confidence that a new robust and multi-year rally seems very likely. Our weekly charts use the number 89. This means that we are incorporating 89 weeks of data. One or two outliers, up or down, have no effect. We are focused on the trend. (Remember once we described charts as “containing the tide, the current, the waves and the ripples” – all derived from very long to very short time intervals that apply to each circumstance.)
It is not an exaggeration to say that our weekly chart is a “tide chart.” The use of a long term setting of 89 guarantees that to be the case.
Notice on this chart that, while we are primarily focused on TSI, we also show long term MACD. In both of the prior sustained upward rallies for copper, MACD starts out below the zero line, then climbed above it. Currently, MACD is in a good position, just below the zero line with lots of opportunities to climb above it. Also note that Trend Momentum, shown at the very top of the price chart, has already turned positive. (See Green over Red.)
Another key indication that the chart has multi-year potential to rise further is the well defined downward trend line. A break out above this line will attract traders to copper equities.
Trading Strategy and Wrap-up
We have enough information to make our decision on how to approach the “copper trade.”
Our approach to determining the timing of our trade has three components.
- TSI Cross Over Confirmation: requires two consecutive weekly closes above $2.95
- Trend Line Break Out Confirmation: requires two consecutive weekly closes above trend line
- MACD Cross Over Zero LinE: requires two consecutive weekly closes above zero line.
These are the “technical conditions” that we can use to enter positions on copper stocks, nominally on the basis of 1/3 position size when each condition is fulfilled.
Afterthought
It is always a good idea to consider how a trade can go bad. In the case of copper and copper stocks, much depends on how well the two largest trading blocks, the USA and China, continue to respect their bilateral trade agreements. China continues to inspire less – not more – confidence. Concerns about how China handled the virus situation, its planned dominance of 5G technology, and, most recently, its perceived corporate espionage out of the Chinese consulate in Houston, Texas put external pressure on existing trade pacts.
One can easily make the case that there is too great a risk to consider copper or copper stocks as a place to invest. This is why we show a staged, three-part, entry into copper stocks. (As an aside, another key trade entry-level that stands out on the weekly copper chart is $3.30.)
On the other hand, the future performance of copper might be the very best way to distinguish rhetoric from policy.
-John Top


