Rising Ichimoku Clouds Precede Price Rise
Last month we noticed something a bit unusual in the stock chart for Sernova (TSX-V: SVA) (OTC:SEOVF), a small pharma company advancing diabetes research via the development of an “implantable pouch.” The medical thesis was to create a “cell reservoir” inside the body. Various medicines could then be used by the body to repair itself or carry out essential functions, such as using insulin to help turn glucose into energy. This particular function is well understood by medical research.
But what happens to people with diabetes? Their bodies do not make enough insulin to break down glucose into energy. This is a big problem. Diabetes is a disease that can negatively affect the heart and liver; it also can result in nerve damage.
Enough about fundamentals – what about the stock chart?
Let’s take a closer look at what we said, when we said it, and what happened afterward.
About a month ago, on December 15th, 2020, we wrote:
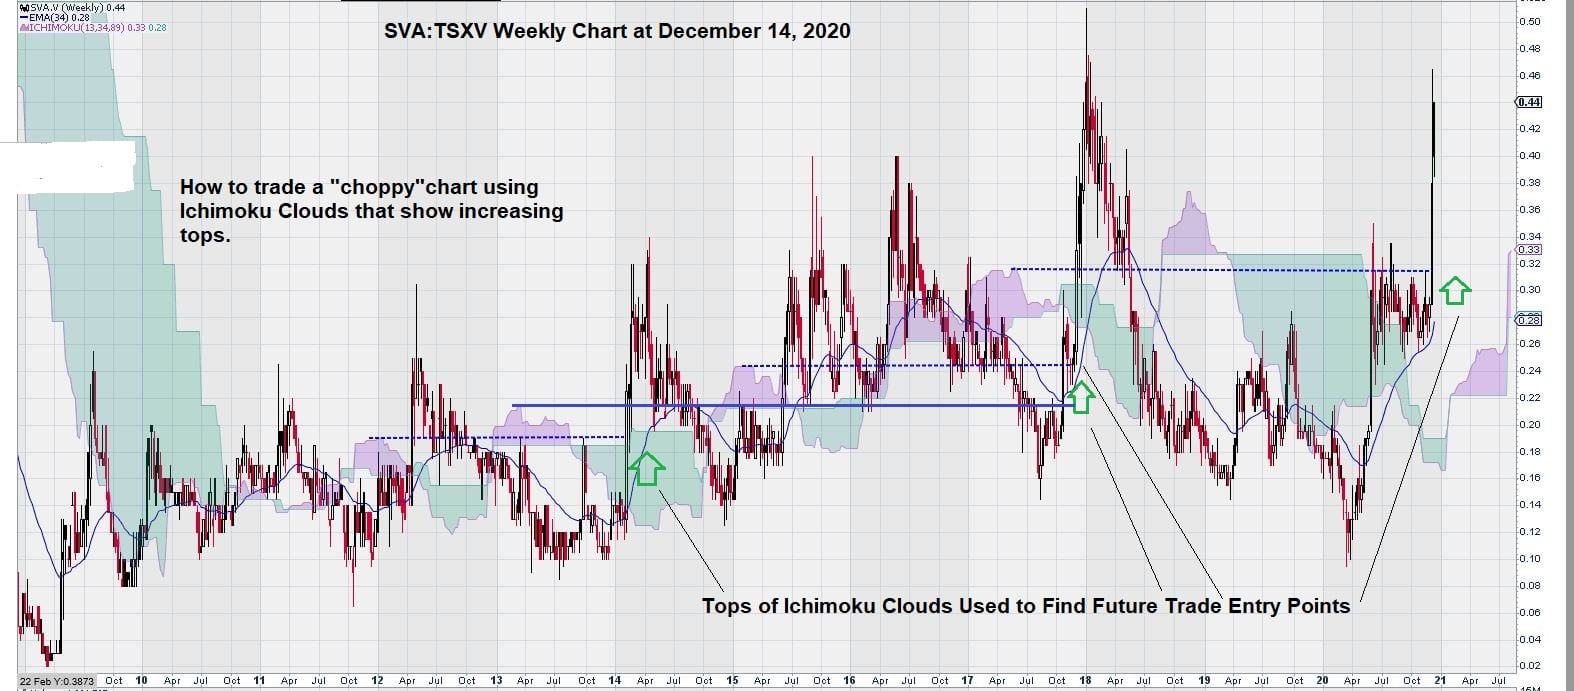
“Separately and by observation only, we note some interesting aspects of the price chart that seem to be related to the Ichimoku Clouds that are forming over the years as SVA continues to advance in a step-like fashion.”
to describe this chart:
A “cleaner” version of the same chart, after the price made a dramatic advance, is shown below.
The chart is dated January 22nd, 2021:
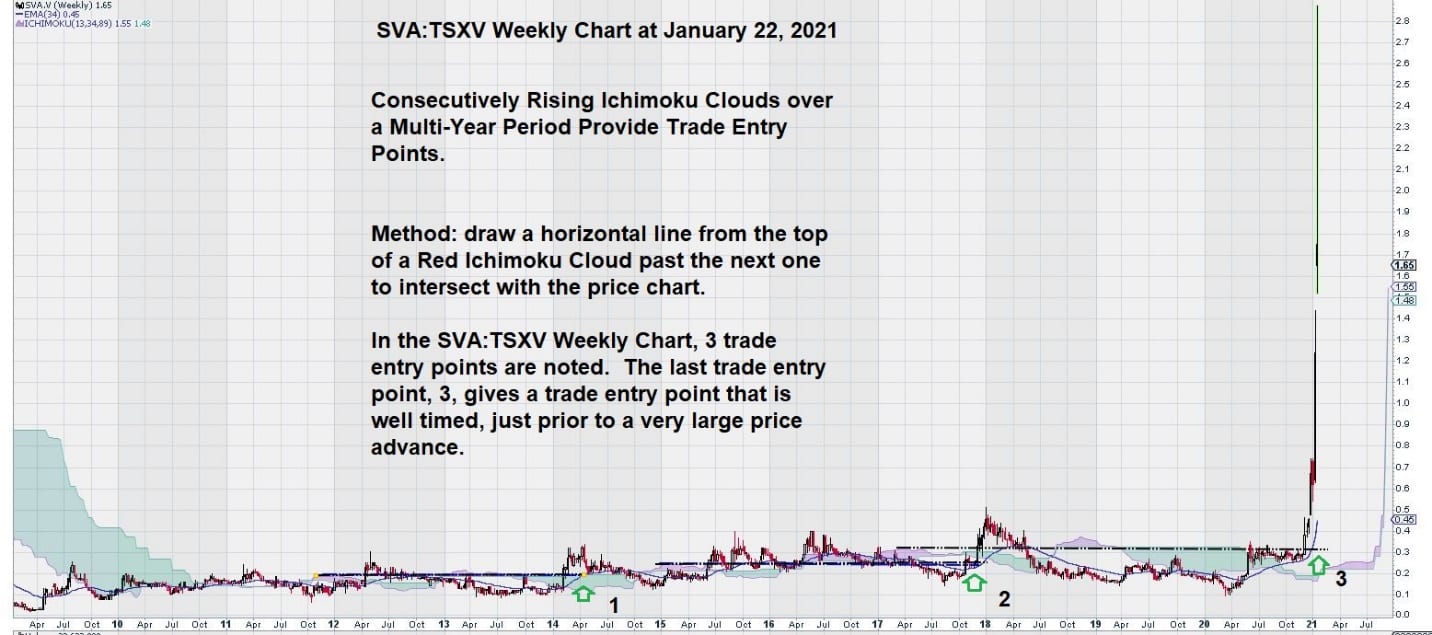
It is important to understand that what we see in this chart is a slow and steady accumulation of SVA shares into stronger hands. This chart shows what happens when management is able to effectively communicate their corporate message to a shareholder base that is willing to give the company the necessary time required to advance its slow-moving scientific research.
It seems that investing in pharmaceutical research companies is all about the various clinical trials that need to be conducted in order to prove efficacy and safety. Once this occurs, the response in the market can be very pronounced, as noted in the chart.
We deliberately held off on commenting further on SVA until there were a few more days of trading.
This has now occurred, and here is an updated chart:
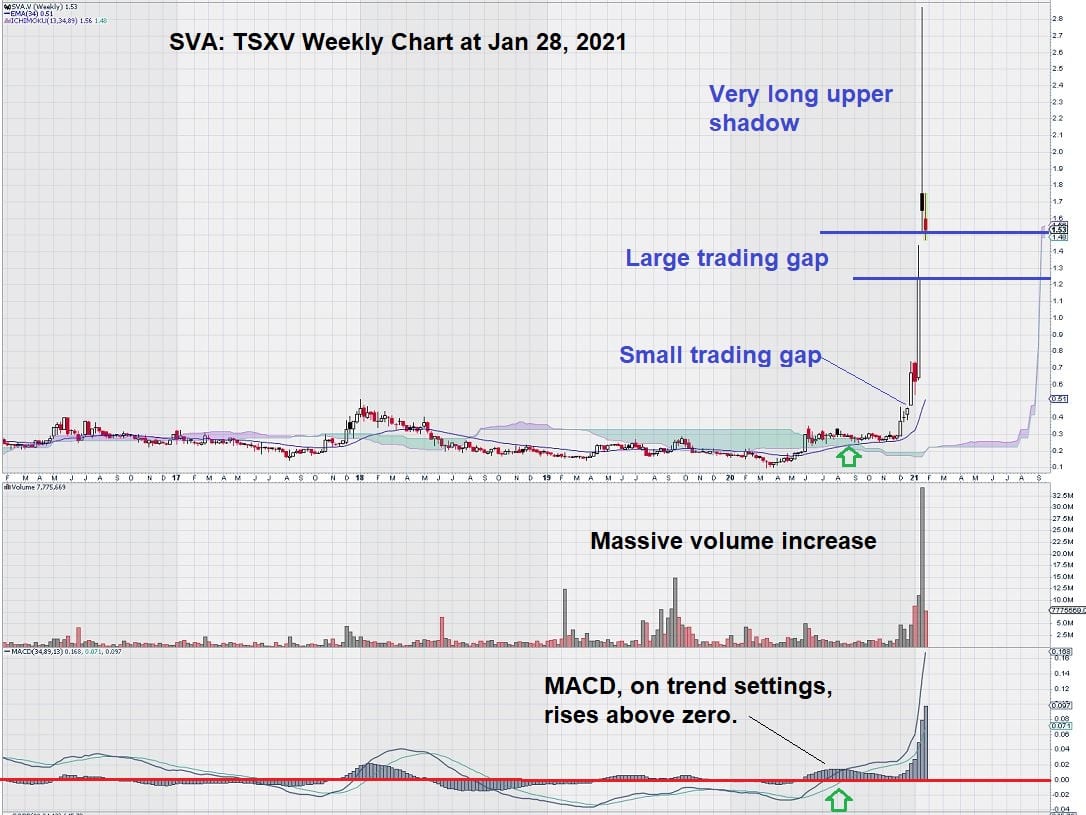
So, what does the new stock chart for SVA tell us now?
This chart shows a revaluation of the company based on results. On January 18, 2021, SVA announced additional positive preliminary data from an ongoing U.S. Phase I/II cell pouch clinical trial. The market obviously liked what the company had to say, and the stock responded accordingly.
We’ll continue to track SVA going forward. Strictly from a technical viewpoint, it would be helpful for the large trading gap to close. This would be chart positive. In the near term, there could be further weakness for the shares as the market attempts to fill in the trading gap. This is not a great concern for two reasons:
- A large new audience of investors has been created from the massive volume spike.
- This much needed added liquidity will result in a better pricing model in the form of price discovery.
There looks to be a good chance for more good news in the future. Today the company reported that it has entered into collaboration agreements with several global leaders in the pharmaceutical industry.
For strategic reasons, details of the identities of these companies were kept anonymous at their request.
Summary and Wrap Up
There was a “lesson learned” with the SVA chart. Multi-year ascending Ichimoku Clouds must not be ignored. This pattern shows internal strength that is slowly building. For those who like to visualize, it is like a rocket on the launching pad being fueled with propellant.
We are confident that we will identify this specific chart pattern again, maybe not just in the pharmaceutical industry but also in other sectors.
For SVA, the catalyst was clinical trial results; for others, it may be a discovery or a new technology.
It is exciting to have the tools to identify “elephant” trades.
– John Top.