Several weeks ago, we highlighted a weekly chart for the $USD that showed it trading within a defined rangebound pattern – at the upper edge of the range. Here is the chart:
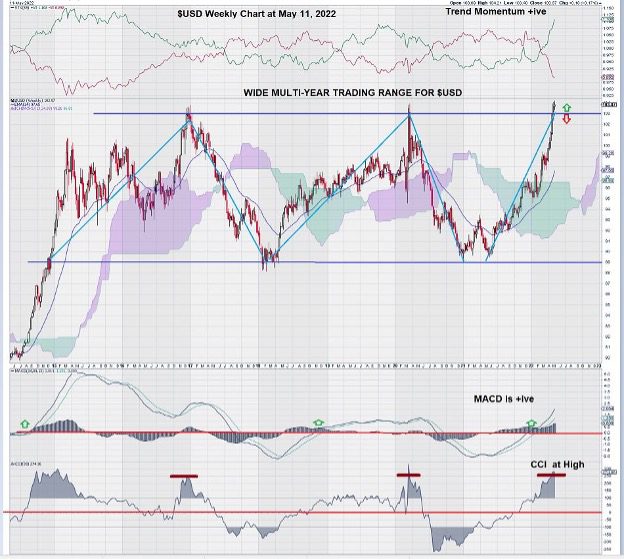
We commented that while MACD and Trend Momentum were positive, CCI seemed to be near a “high,”; signaling possible near-term weakness.
Here is an updated chart:
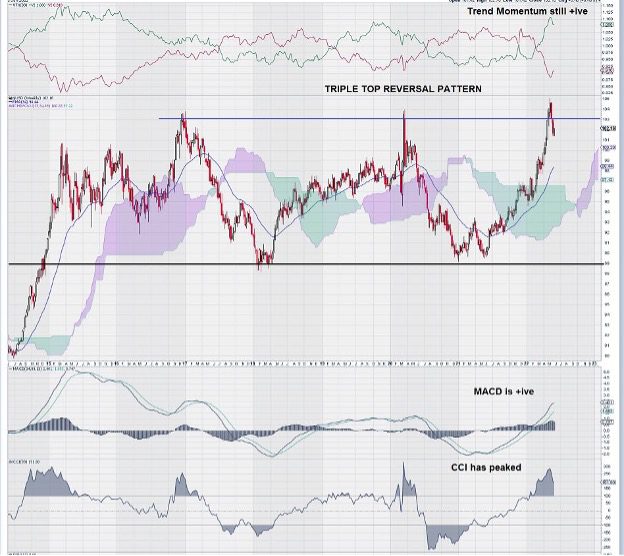
We see that the previously established resistance level of $1.03 was exceeded by two consecutive weekly closes above it. This (almost) meets our self-imposed trading requirement of “two or three consecutive weekly closes above a chart level”; resistance or Fibonacci or previous high closing level.
In this case, we know that the $1.03 level was a key resistance level, so any trade decisions would be made at the earliest in week 3. Strong selling over the course of week 3 that negated the gains in weeks 1 and 2 indicated that a reversal had begun.
In week 3 (the week denoted by the large red candlestick next to the red downward arrow at the far-right-hand side of the chart), we see a strong reversal to the downside. We notice that it also negates the previous positive candlestick because it forms a “dark cloud cover .” This happens when the trading for the week opens at or above the prior week’s close and then closes below the open of the previous week.
Here is a closer look at the “dark cloud cover”:
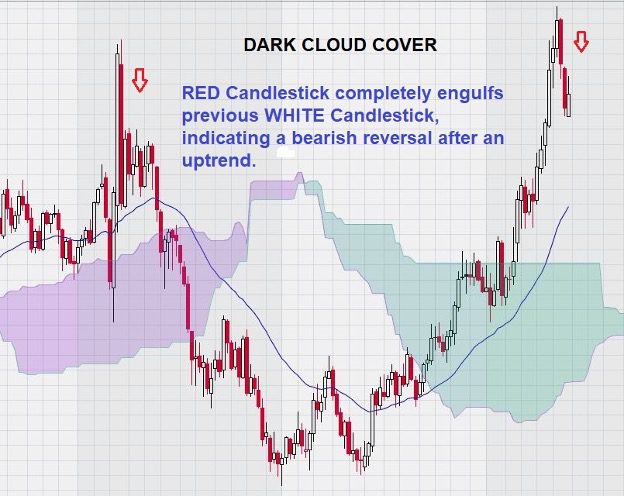
Notice that not only does the large red candlestick completely engulf the previous white candlestick but also the one before it as well.
This means that the gains made in trading for two weeks at a level above the key $1.03 resistance level were wiped out by one week of strong trading to the downside. This trading action is too strong to ignore, and much weight must be given to it.
Summary and Wrap-Up
Here is a review of our chart analysis and trade guidance from the middle of May:
“The wide, multi-year trading range for the US dollar conveys a note of caution. Twice in the past few years, we have been here before. Each time, the optimism of a further advance for the $USD was washed away, and a significant decline followed. Is this another one of those times?”
Our question was answered in the form of a reversal at a key resistance level: $1.03.
Despite two weekly closes above this level, a good technical sign, the reversal was harsh, strong, and swift.
We noted that “CCI was the go-to technical indicator” for this chart. For the third time, CCI gave a clear indication that downside risk far exceeded the potential for further upside gains.
Looking ahead, a “re-test” of the $USD Index at the $1.03 level from below is another condition that remains possible in the near term. Despite the actions of the FED to continue raising interest rates – actions that were expected to add further strength, not weakness, to the $USD – a new period of $USD weakness may be underway.
We look forward to seeing how the weekly chart for the $USD will react to the next two FOMC meetings in mid-June and near the end of July. It is highly anticipated that two further interest rate increases will occur on these meeting dates.
– John Top, the technical trader