Waking up from the COVID Coma
At the start of this year, the trading in Platinum Group Metals (TSX: PTN) (NYSE MKT: PLG) got our attention.
Let’s go back to January and review the weekly chart we posted and what our expectations were going forward.
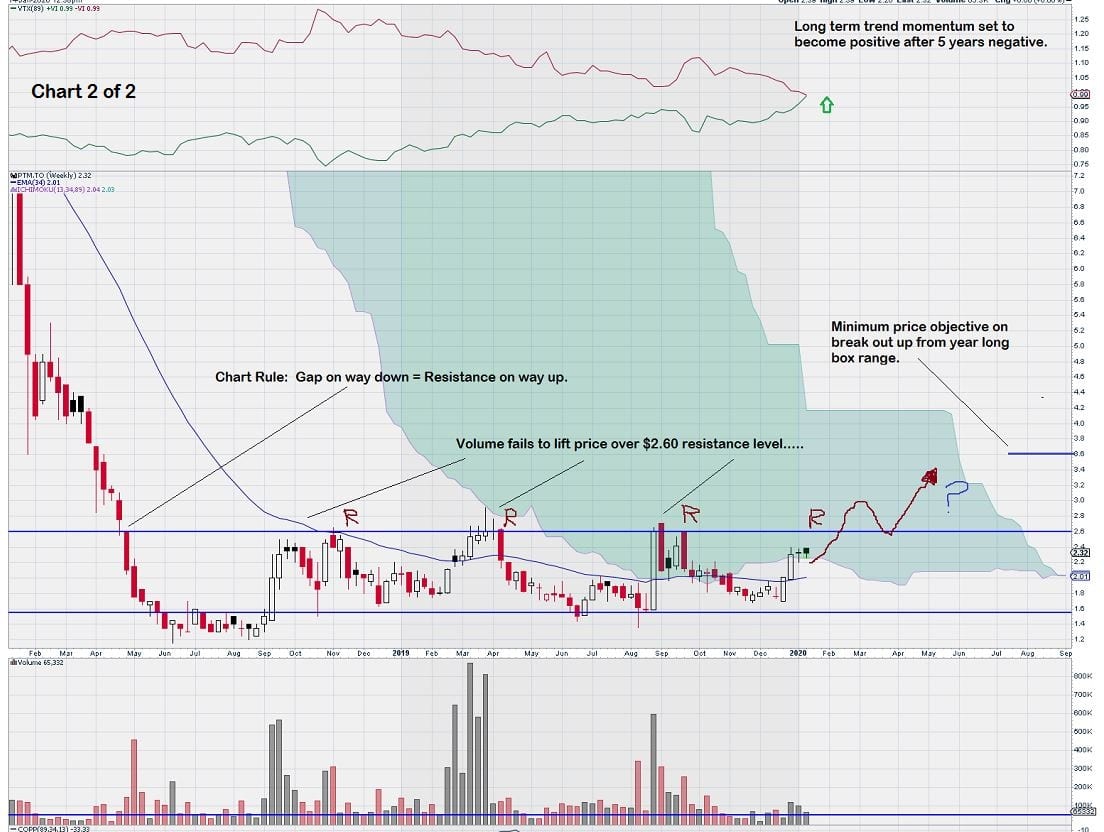
We had determined that the key break-out level for PTM was at C$2.60.
Our expectation was for a technical buy signal to be generated above it with confirmation by way of 2 consecutive weekly closes above, preferring to see the 2nd close with a “better” candlestick. This would imply that there was enough positive momentum such that we would not be “whip-sawed” by a false signal.
Remember that PTM had made an agreement with Impala Platinum in November 2017 to eventually hold a 50.01% in one of the world’s largest undeveloped platinum/palladium projects. Impala certainly knew its way around the Pt/Pd space – here is a description from the November 2017 press release:
“Impala Platinum Holdings Limited is one of the world’s foremost fully integrated producers of platinum and associated PGEs. The group produces approximately a quarter of the world’s supply of primary platinum.”
During 2018/2019, the consortium of companies, including Impala and JOGMEC, Japan Oil, Gas and Metals National Corporation, continued to support the PTM management team’s efforts to advance the large Waterberg platinum/palladium project.
The weekly chart for this period, 2018/2019, shows a rectangular box range chart pattern with a low of approximately $1.40 and an upper bound of about $2.60. We were looking for a break-out above the $2.60 level and for confirmation.
Let’s look at what happened in 2020.
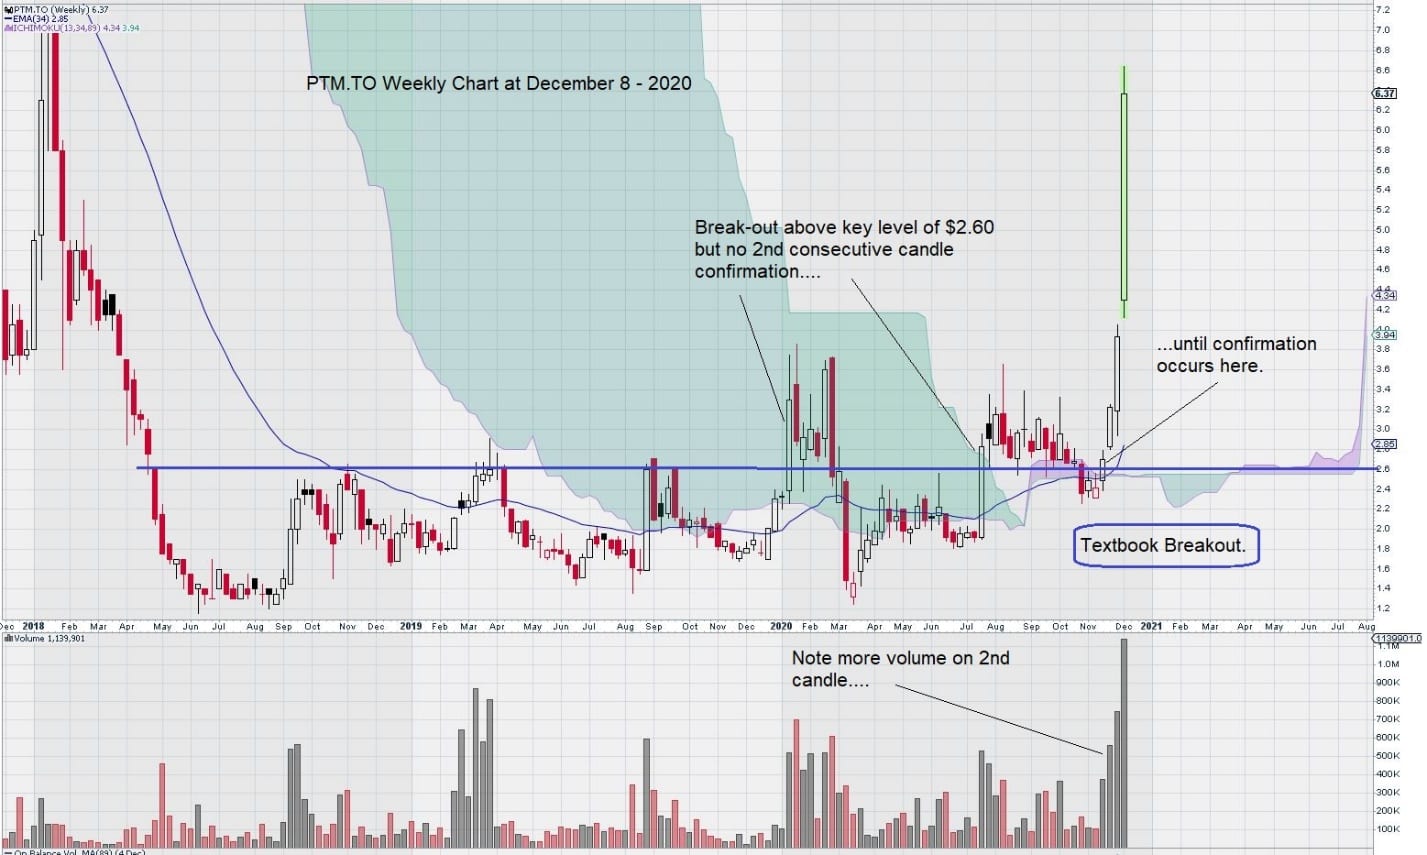
This chart clearly shows how important it is to “follow the rules” and wait for break-out confirmation via the all-important 2nd candlestick. Notice that PTM broke above the $2.60 level twice but both times failed to meet our charting requirements of a “better” candlestick on the 2nd week.
Both previous candles that broke above the $2.60 level also had less volume on the second candle; not what we expect to see happen.
There were other chart indications that “this time is different.”
What were they, and what story were they trying to tell us?
Here is a closer look at On-balance volume (OBV), a technical trading momentum indicator, and Accum/Dist, an indicator that uses volume and price to assess the strength of a stock’s price trend.
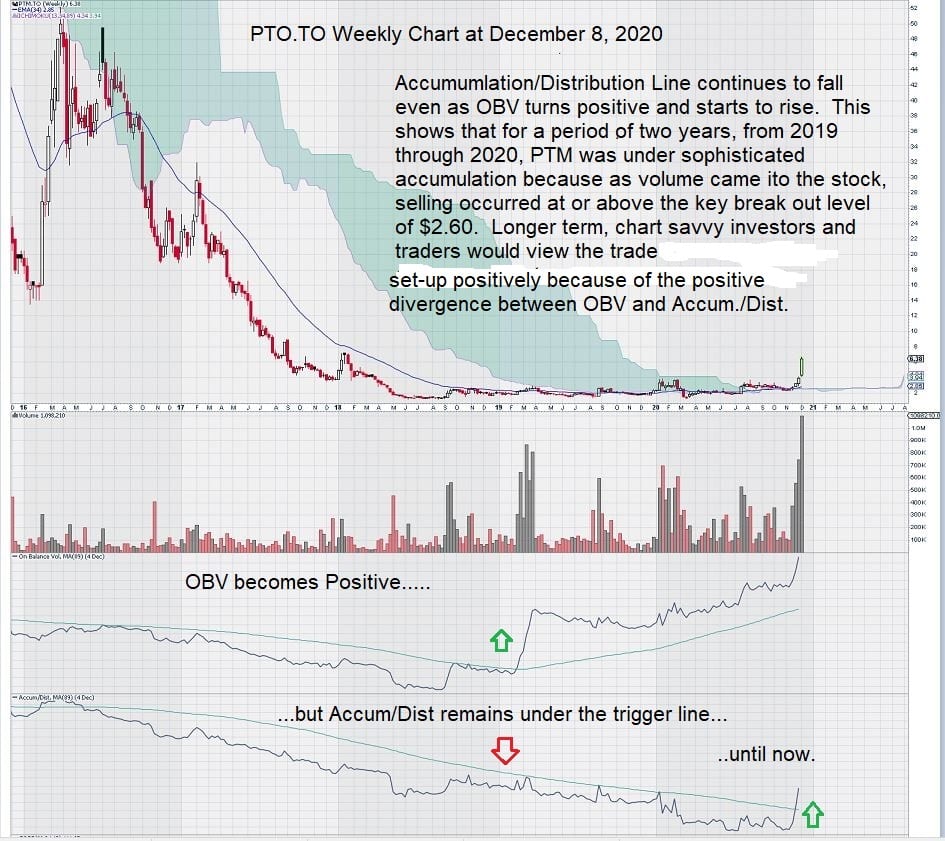
This chart shows how different the past few weeks of trading is compared to the past two years. Accumulation/Distribution Line was steadily falling, telling us that the two previous false rallies for PTM were just precursors to the “real thing.”
Summary and Wrap-up
Early in 2020, we correctly zeroed in on PTM as a possible trade candidate. Two separate events derailed our anticipated timing for a confirmed break out to the upside.
The first was the announcement of the “mandatory lock-down” of the global economy due to COVID. The second was the quick response by Impala, in June, that that they were not going to proceed with exercising their option to gain a majority stake in the Waterberg platinum/palladium project. The first announcement had a sudden negative impact on the price of PTM shares; a decline from around the $3.60 level back down to $2.40 was swift. The second announcement had very little impact on the shares, given what it represented. In fact, a few months later, the shares had easily recovered beyond the level they were at before the announcement.
Just as “Dr. Copper” is certifying that the health of the global economy is soon to improve, the steep rise in the shares of PTM are telling us that the global economic outlook looks rosy. Platinum/Palladium is used in fuel cells and are primary components in catalytic converters.
Perhaps we should be looking at a few auto stocks – other than TESLA….which has no need for them.
-John Top