5 Years of Negative Trend Momentum Now Turning Positive
(Chart Educational Segment – 003)
I once watched a movie called the Curious Case of Benjamin Button, a character played by Brad Pitt. It was about a man who aged backward – quite a clever premise for a plot.
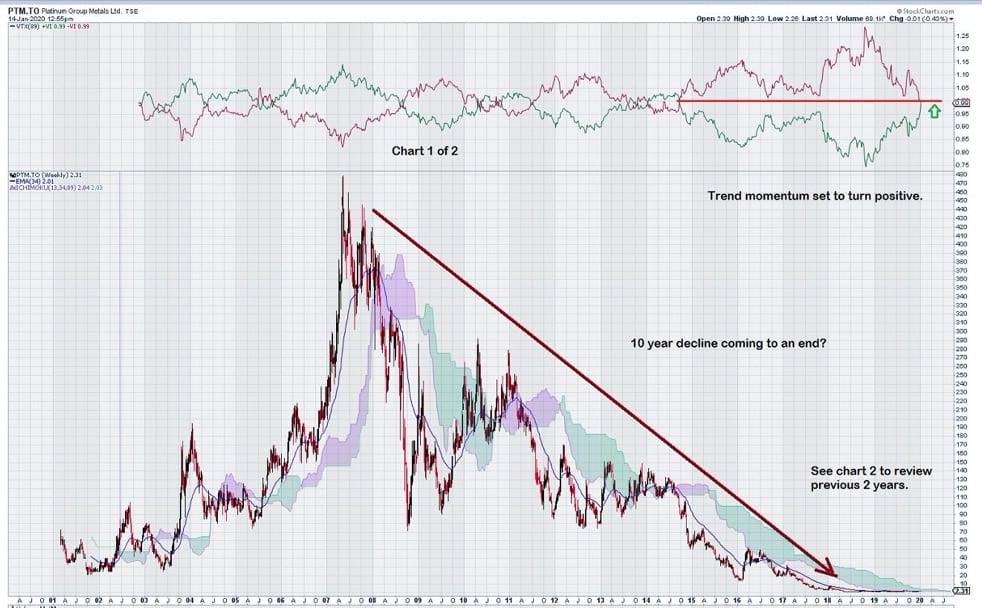
This is how I feel about Platinum Group Metals Ltd. (TSX:PTM / NYSE:PLG). A quick look at the stock chart should tell you why.
The Telescope
It is quite evident that shareholders have had a miserable time over the past ten years. But is there now some room to be optimistic? Perhaps. Lets put away our 20-year telescope and pull out our 2-year microscope and see if we can apply our charting knowledge to diagnose a potential future outcome.
The Microscope
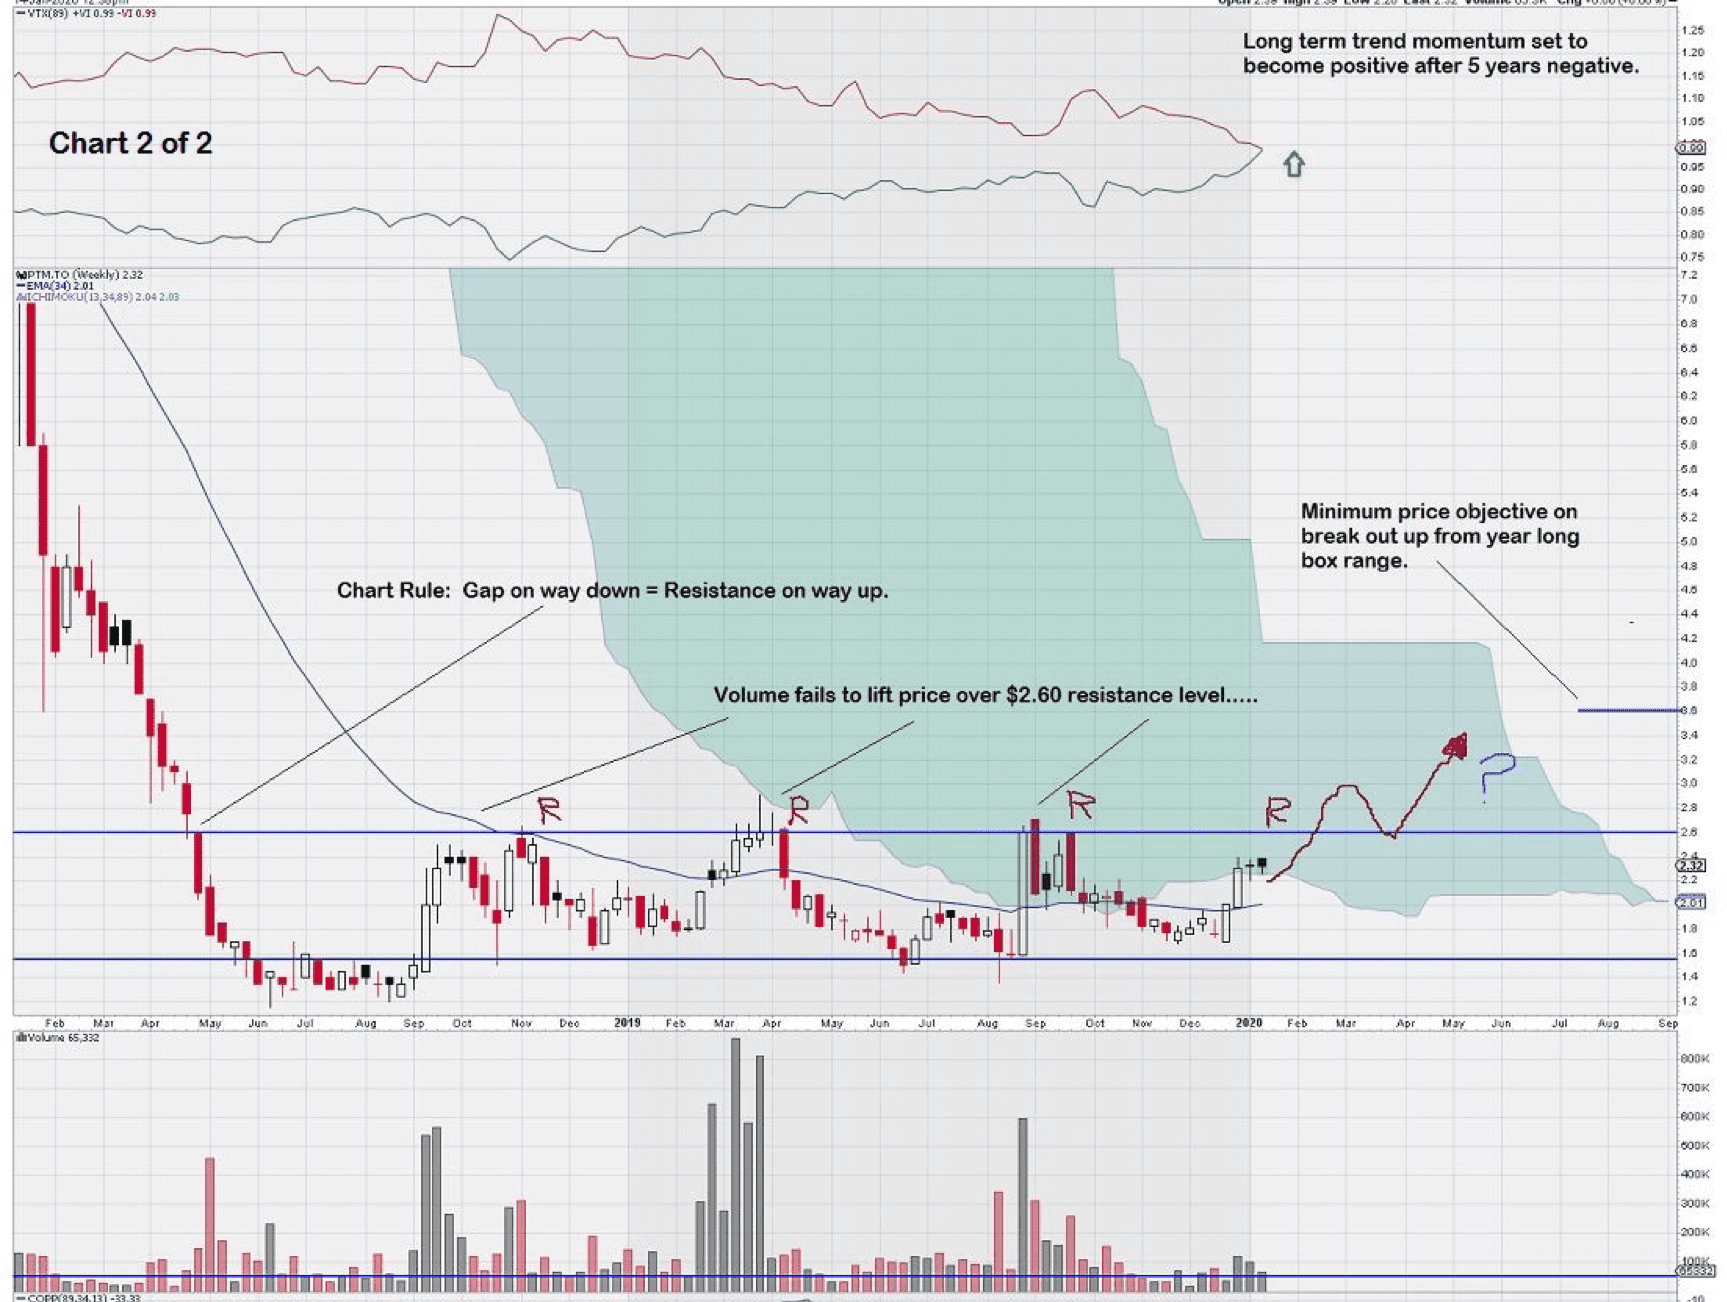
This two-year chart for PTM.TO has a story to tell. One of the “laws of charting” is that “Gaps on the Way Down become Resistance on the Way Up.” Notice that there is a clear gap on the way down at the $2.60 level that did indeed cast its future shadow outward to the right-hand side of the chart. True to form, resistance has been encountered at $2.60 three times. It appears that a fourth attempt to break through this key level is now underway.
It is instructive to keep an eye on long term trend momentum, which is on the verge of turning positive after five years in negative territory. This could be signaling a positive change in investor sentiment.
So what is causing investors to sit up and take notice of a stock that has essentially declined for ten years? And why now?
In December 2019 Platinum Group Metals Ltd. announced that shareholders of the Waterberg Project approved a definitive feasibility study. This important step forward further advances the project.
Joint venture partners in the project include Impala Platinum Holdings Ltd., Japan Oil, Gas and Metals National Corporation, Hanwa Co. Ltd., and Mnombo Wethu Consultants (Pty) Ltd. Impala has various rights and an option to increase its interest in Waterberg, as noted in a PTM press release dated November 6, 2017.
Trading Strategy and Wrap Up
PTM.TO has got our attention, and we will watch it more closely, awaiting the test of the key resistance level at $2.60. We know that we are not trying to “time the trade.” What do we mean by this?
Years ago, I came across a simple phrase that I have confined to memory.
“The Fat Middle”
So what exactly is “the fat middle.” This refers to the “safest” part of any trade being 20% from the bottom and 80% from the top. Long term weekly charts with non-standard trend settings guarantee that we will always be “late” to the trade. But this also weeds out the many “whipsaws” that so often occur with trading that is based on much shorter time intervals.
Our trading strategy is to use technical analysis as a guide to finding inflection points in long term trends. We like to see chart confirmation validate our expectations and are willing to “give up” the bottom 20% of a trade in exchange for a higher level of confidence.
PTM.TO is a good example of how being patient keeps us out of the whipsaws that have occurred over the past two years. We are waiting for at least two consecutive weekly closes above $2.60, and we prefer a better candlestick on the 2nd week.
We intend to re-visit the PTM weekly in a few months to check in to see if it is any closer to breaking out its well-defined box range.
John Top
Disclosure: We currently do not own a position in PTM at the time of this writing.


Wow. In less than 48 hrs of reading this, the stock is up nearly 40%. Great call and keep em coming!