
Let’s look at the 16-year weekly chart for the Dow to try and get some perspective on the “raggedy” trading we have noted over the past several months.
Our sense of the trading is that, so far, trading in the Dow is defined by indecision. This is evident by the growing number of “spinning tops” we are noting on both the daily and weekly charts.
Here is the weekly chart:
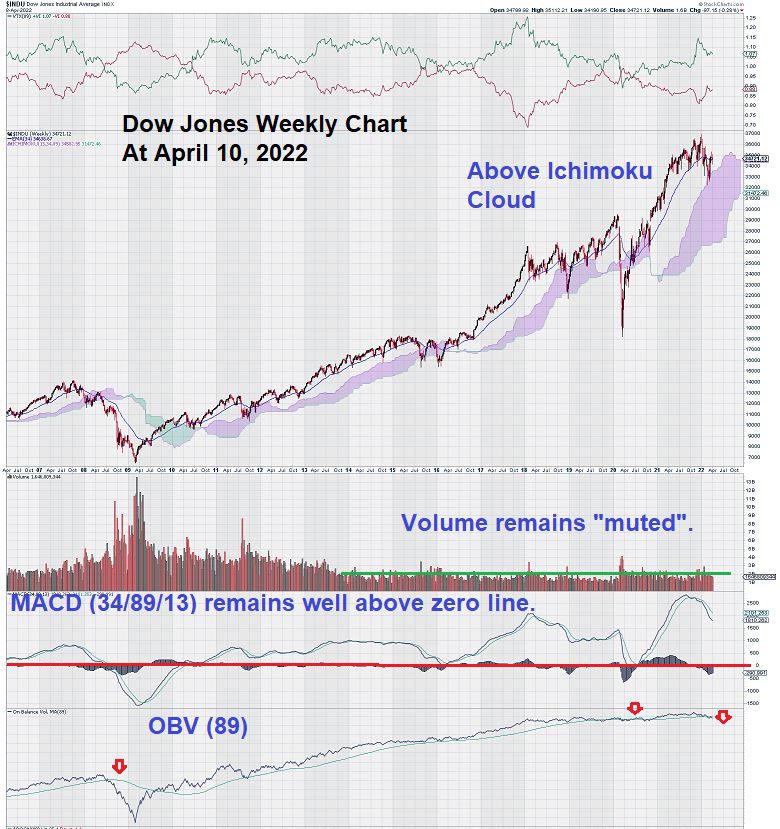
We extended the chart far enough back in time to compare how the DOW is trading today versus the period before and after 2008 when interbank overnight lending stopped.
One visually obvious comparison jumps off the page: volume. For the past eight years, volume has been “muted,” even the pronouncement of a global pandemic did not “shake the tree” and caused investors to lose their confidence in the stock market. There was only a slightly modest increase in volume that accompanied the decline of the Dow back below the Ichimoku Cloud in the spring of 2020, and this was very brief.
A strong recovery followed the dip below the lower base of the Ichimoku Cloud.
OBV makes an even stronger case. Since 2008, OBV has been on a slow, steady, and predictable rise. Only recently do we see OBV start to dip below our trigger line that uses a long-term weekly setting of 89.
Now we turn to MACD. Our MACD settings on the weekly chart reflect the trend, and they ignore small whipsaws. MACD remains well above the zero line, even as the signal line has declined below the zero line, and both lines currently are in a steep decline. This suggests that further erosion in the level of the Dow going forward seems the most likely future outcome.
There are two important technical considerations that we must accept before getting too sold on the idea that the weakening MACD we are seeing will lead the Dow lower. The first is the lack of volume, which tells us the uncertainty in the market is not consequential enough to cause investors to consider rotating out of stocks and into other investment alternatives. Secondly, the Ichimoku Cloud is a great visual aid that reminds us that the trading action has not resulted in the Ichimoku Cloud being tested for support. One month ago, the top of the Ichimoku Cloud provided a springboard for the recent rally.
The daily chart for the Dow reveals how MACD reacts once it falls below the zero line:
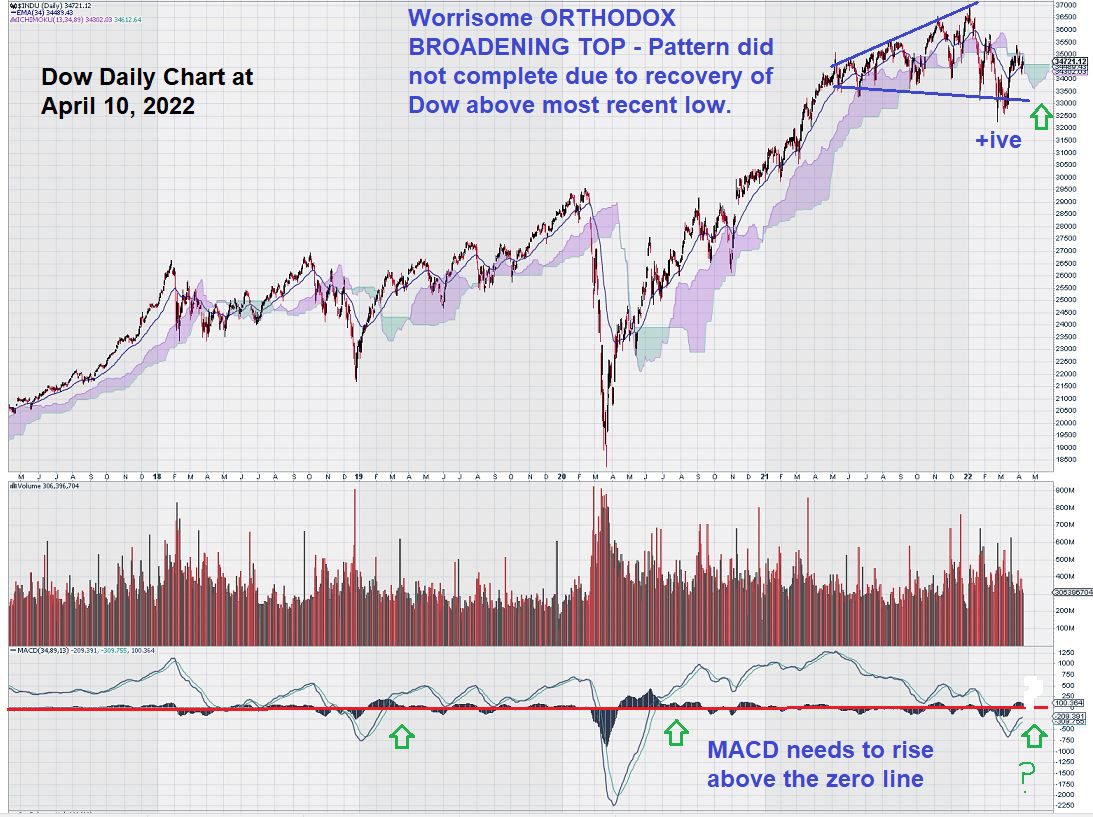
The daily chart for the Dow provides us with the best trade guidance going forward in the near term. We will be tracking MACD to see if and when it rises above the zero line.
Alternatively, if the signal line crosses back below the trigger line when both lines remain under the zero line, this would signal a new and different negative sentiment for the market.
We are confident to make this assertion in light of how MACD reacted the last two times (see first two green arrows) when MACD fell below the zero line and then recovered with strength.
Summary & Wrap-Up
Much has been written and discussed about how the expected actions of the FED will impact markets, particularly the US stock market. In some sense, it remains a “guessing game .” This is why volume is speaking so loudly – investors have predictably been “buying the dips,” and, as the lack of volume shows, they are not sensing the same level of “fear” that they experienced back in 2008.
In the weeks ahead, we plan to closely monitor both Volume and MACD on both the daily chart and the weekly chart. Any pick-up of volume that results in further deterioration in the current level of the Dow would help support the Orthodox Broadening Top pattern. This pattern is currently invalidated by the positive trading of the past month. MACD needs to continue on its path to cross up and over the zero line.
Technical analysis allows for some interpretation, but this can only be stretched so far. Our “trend” settings have proven their value in the past, and we will rely on them again in the future. We are confident that our attention is focused on the “right technical indicators at the right time.”
– John Top, the technical trader