


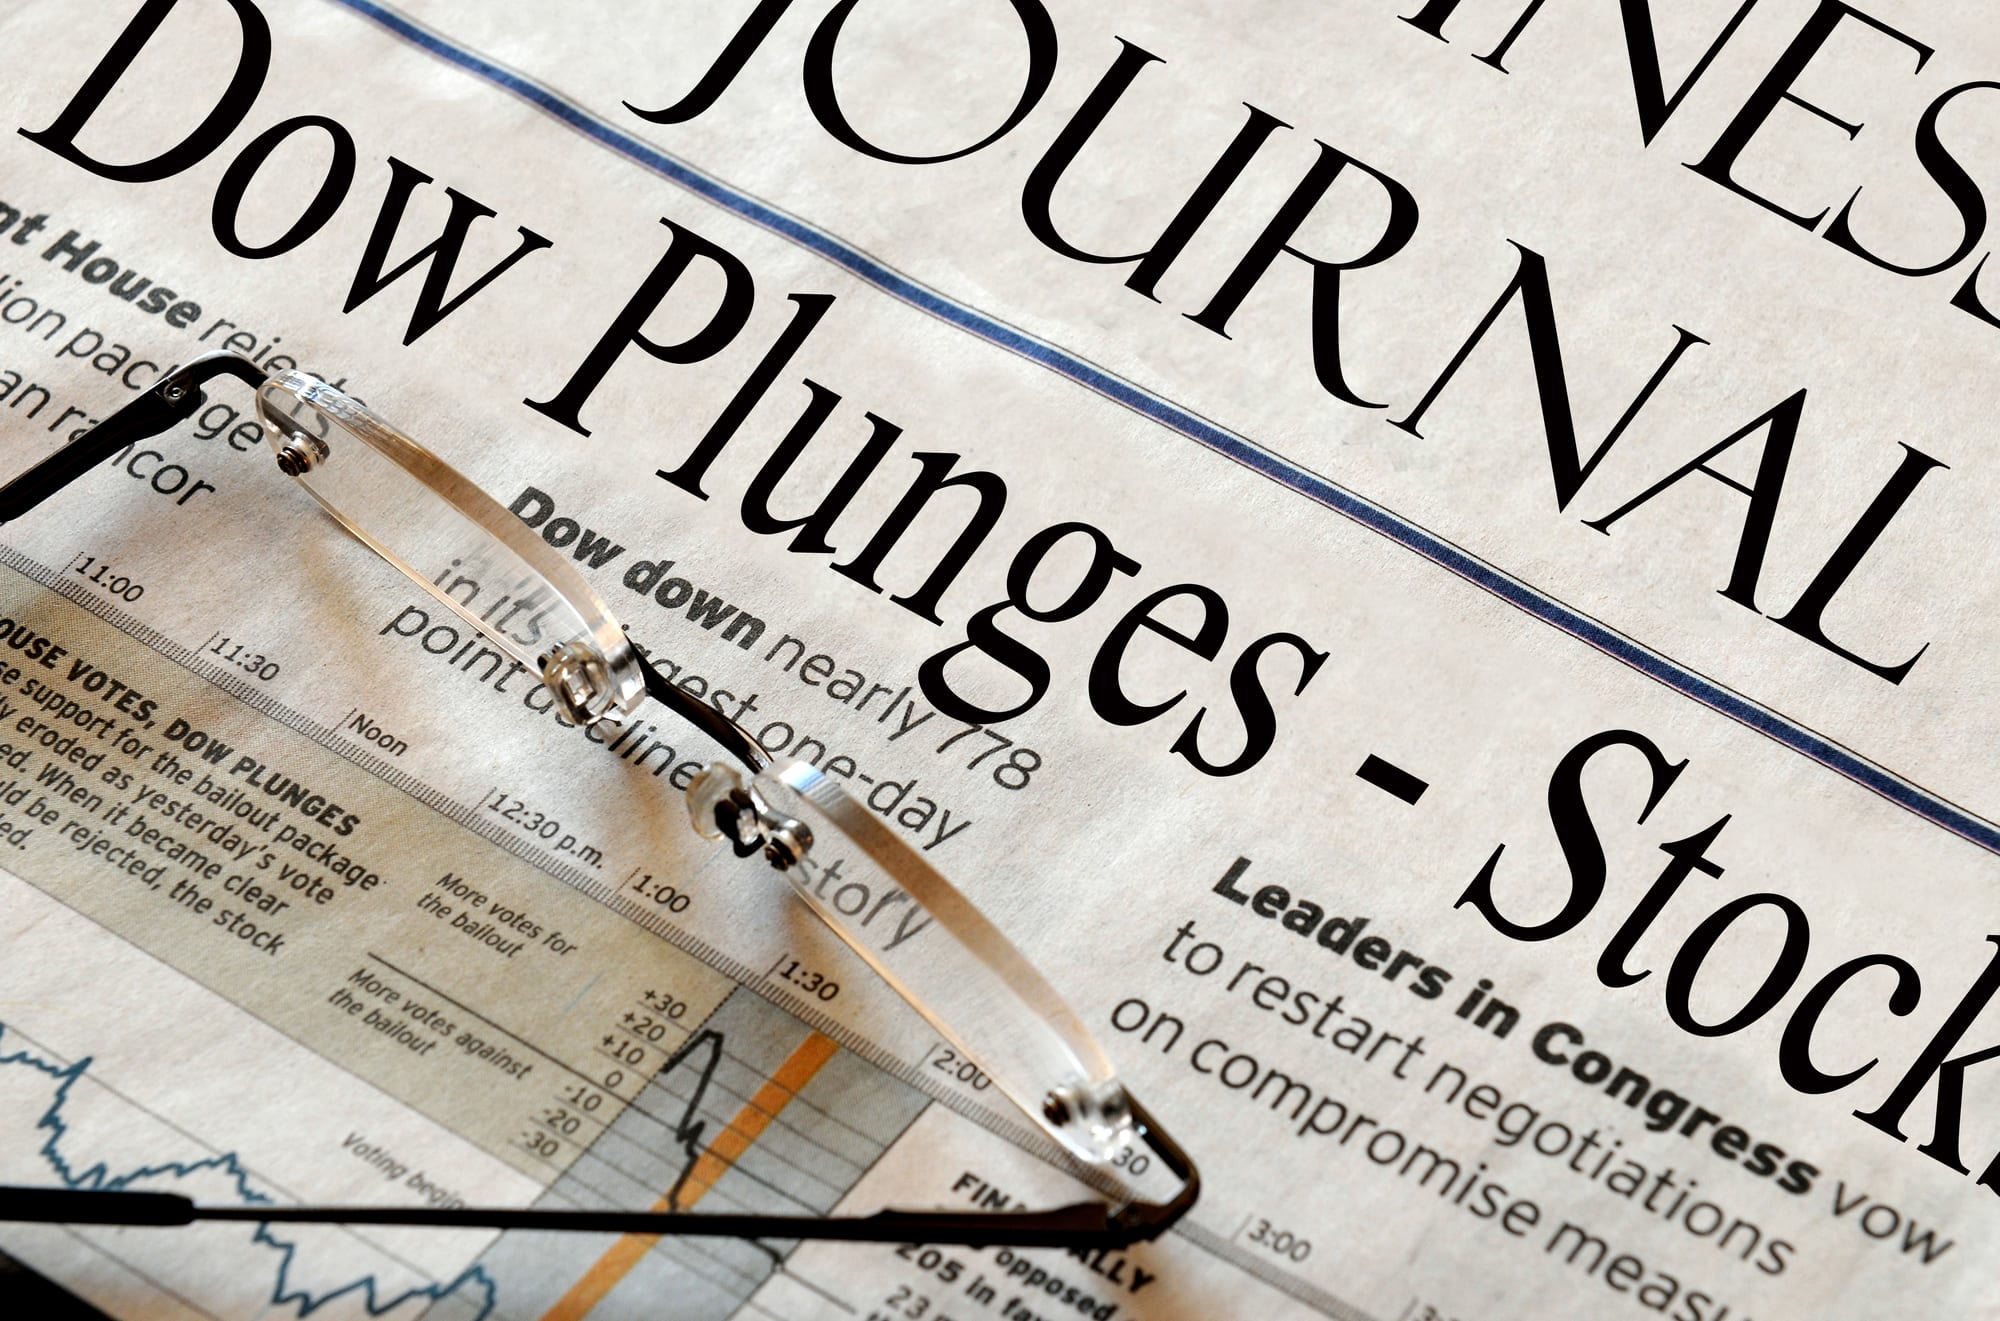
Dow Jones Weekly Chart From 2008: Full of Worry or Hope?
The last time markets got shaken badly was in 2008.
Let’s use that as a starting point and see what a weekly chart for the Dow looks like using two different methods – from that, we can gauge the key level for the Dow Jones Index.
First, we will see what insights we can derive from a very standard way of looking at charts; Fibonacci Retracements. Second, we’ll have a look for any chart patterns that may catch our eye.
Let’s get started.
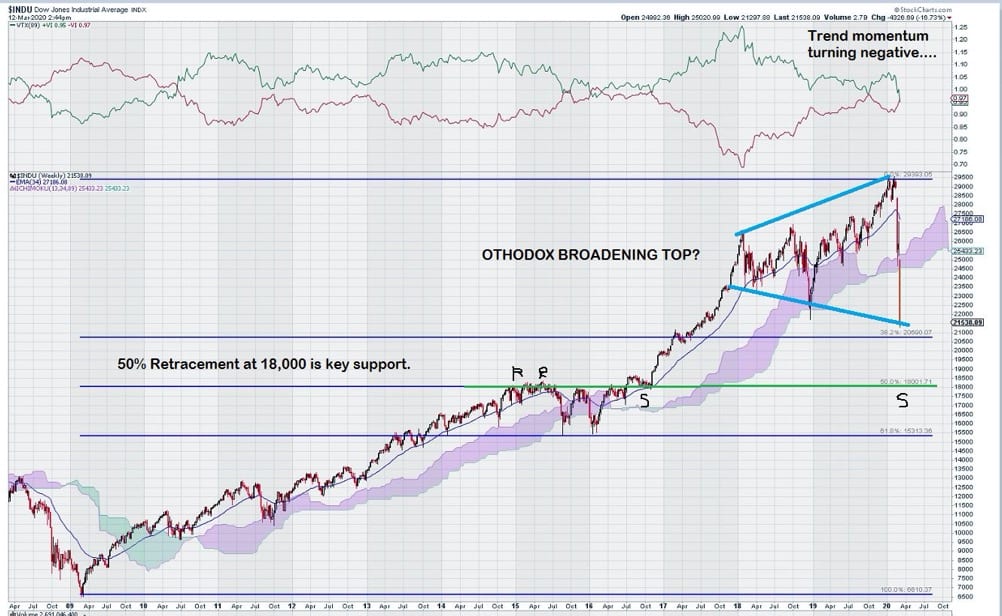
Fibonacci Retracements are commonly used by technical analysts to find areas of anticipated support once a new high has been established. For our purposes, this “new high” was around 29,500 for the Dow weekly chart. We also are defining our “low” at the low reached in 2008, the last time markets saw significant dislocation.
So what does this analysis tell us?
Well, one of the obviously overlooked features of the weekly chart for the Dow is the absence of any meaningful retracements since the 2008-low of just under 7000. In many ways, it is remarkable that the stock market was a “one-way bet” for so long.
But now, more than a full decade later, at least according to this chart, we are getting a “meaningful retracement.” That, in and of itself, is not shocking or unexpected. Why investors are undergoing such angst and worry is simply a function of the time it took for a correction to occur.
The Case for Hope
This chart clearly identifies the 18,000 level as one to watch. Not only is it at the 50% retracement level, but also, 18,000 was a resistance level for the period 2015 – 2016. So we have strong embedded support at 18,000. The “Hope” is that this level holds, and the chart can start to rebuild itself.
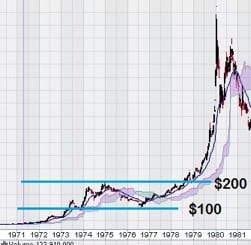
Regular readers of this site may have been informed in the past of what happened to gold during the mid-1970s. A quick review of the long term chart for gold shows a 50% decline from $200 back down to $100 before the impressive upward move to around $850. So you see, while painful at the time, a 50% retracement does not mean that a chart will “fail.”
The Case for Worry
The words “Orthodox Broadening Top” don’t sound that ominous or threatening. After all, markets make “tops” all the time.
So what is the big deal?
Well actually, orthodox broadening tops are a really big deal because they don’t form very often, and when they do, they can be “trend ending.”
In the chart above, we can see the Dow weekly chart changing its previous decade long pattern as it starts to make higher highs AND lower lows; this is important to take note of because this is the pattern of an orthodox broadening top. I will leave it to the reader if they want to absorb more “worry” or even fear by learning more about this particular formation on their own.
The Future?
Our focus is on the close this Friday, and subsequent “Friday closes” as the closing price on Friday is what counts on weekly charts. We are keenly aware that an orthodox broadening top may be forming, and this is something to keep a close eye on.
Additionally, should markets continue to decline further, the 50% retracement level at 18,000 is a key level. Declines of more than 3% below this level would be a concern.
A strong case can be made that the 18,000 level has embedded support that it “earned” by taking two years to penetrate it, so there is sound technical evidence that this level can repel the current decline.


I GOT OUT OF THE MARKET AT ABOUT 29,000 USING A SIMPLE SYSTEM THAT I HAVE USED FOR YEARS..NOW OF COURSE YOU WONT BELIEVE THIS BECAUSE ANY IDIOT CAN SAY IT…I GET DOZENS OF EMAILS EVERY DAY CLAIMING HOW SMART THE SENDER IS..TO ME ITS ALL BS. I HAVE NOTHING BUT DISGUST FOR 95% OF THE SO CALLED “FINANCIAL ADVISORS” FROM THE WIRE HOUSES….THESE STRUTTING PEACOCKS..THESE SCHMOOZERS THESE PARROTS. I DONT PREDICT THE MARKET..I LET THE MARKET PREDICT ITSELF..IF YOU WANT TO CONTINUE THIS CONVERSATION SEND ME AN EMAIL ALTHOUGH I DOUBT THAT YOU WILL