Marijuana Stock Charts Breakdown
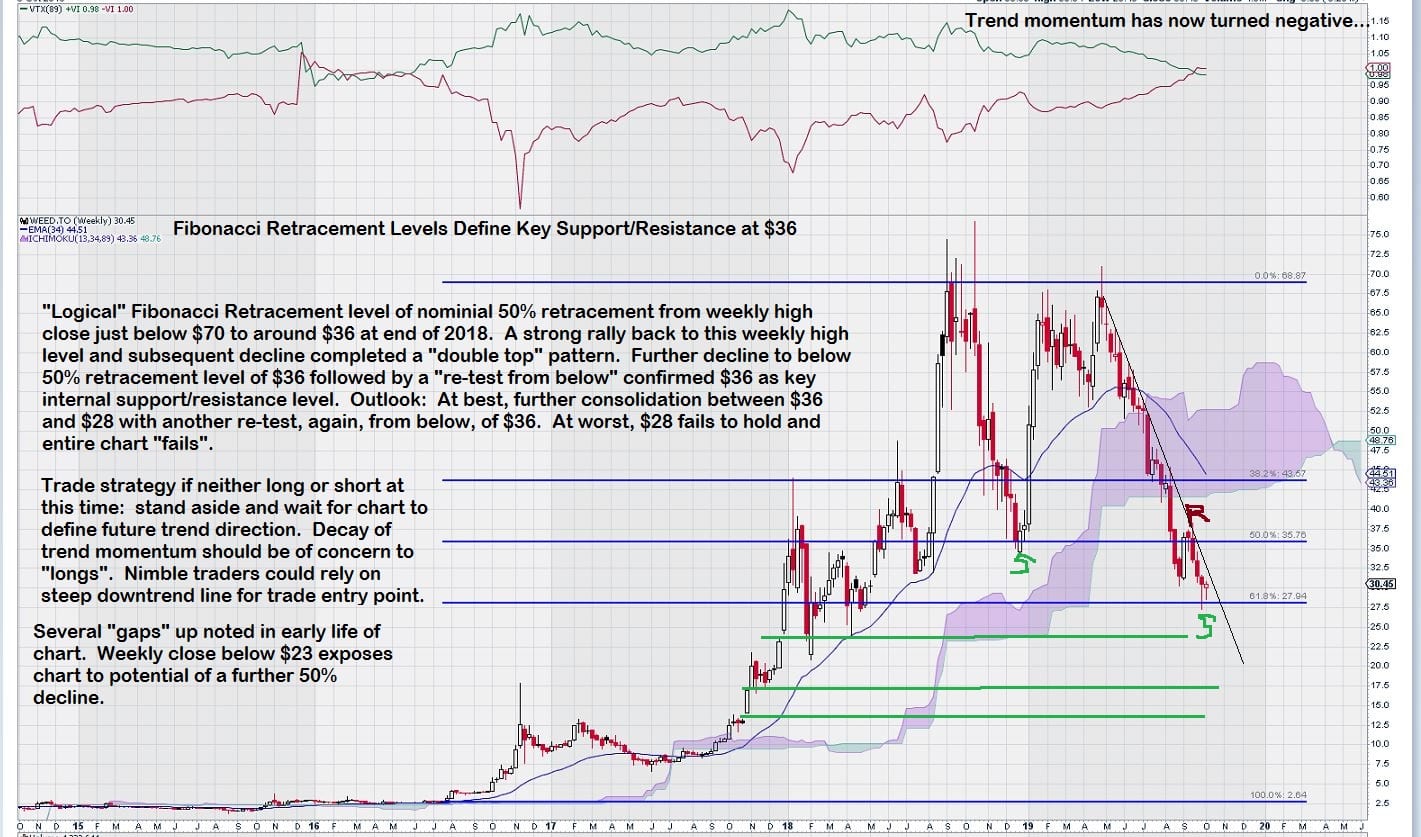
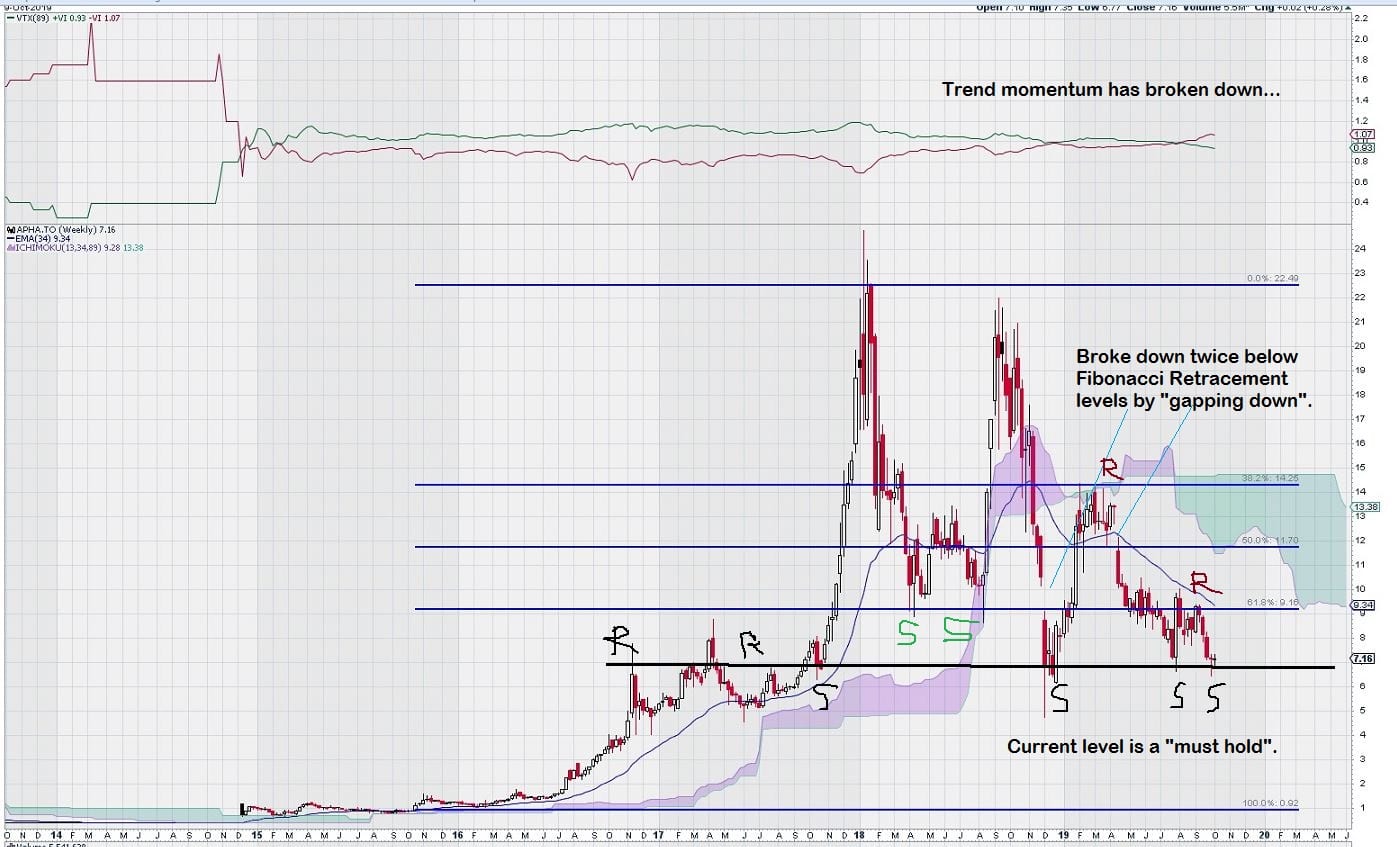
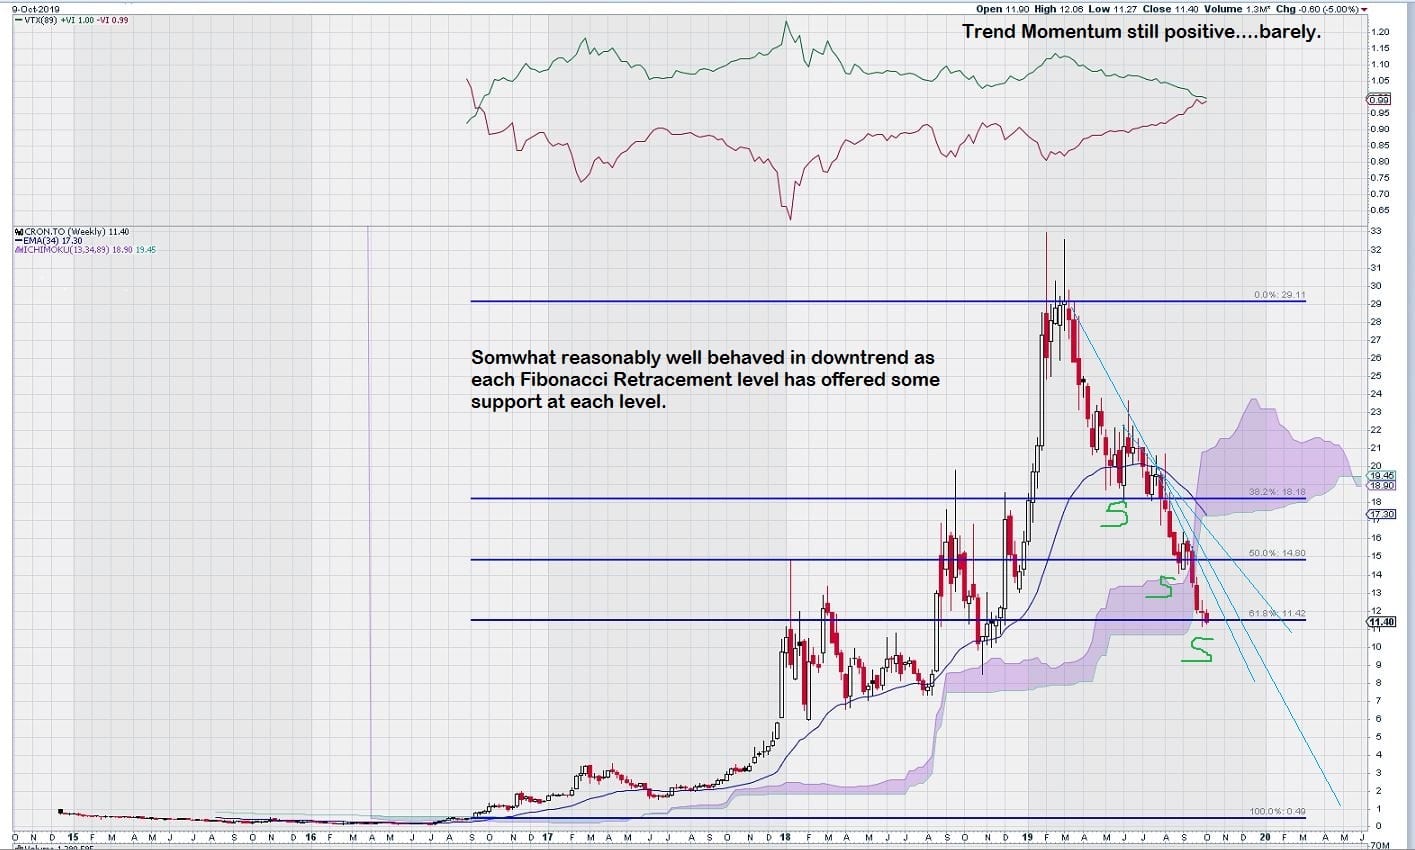
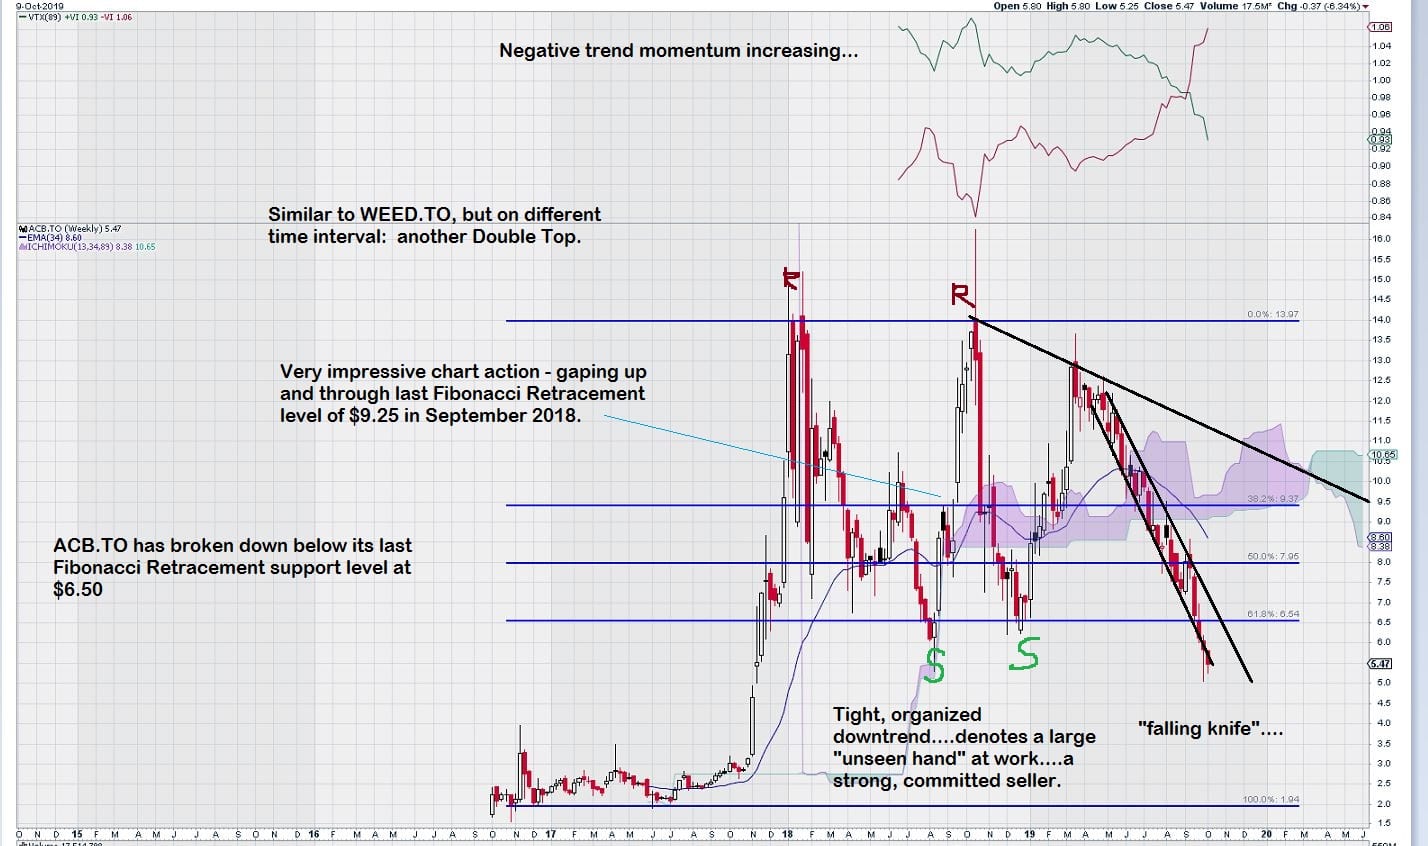
Here’s a look at the top marijuana stock charts. For the most part, it looks like WEED/CRON/APHA are at or near their “final” Fibonacci Retracement support levels. ACB has broken down. The “safest” trade strategy (if flat) is to wait for the 50% retracement level to be surpassed. I say this because it seems like these stocks have strong directional moves; especially to the upside. This is noted in WEED and APHA.
Canopy Growth ( TSX:WEED) Chart Breakdown
Aphria (TSX: APHA) Chart Breakdown
Cronos (TSX: CRON) Chart Breakdown
Aurora Cannabis (TSX: ACB) Chart Breakdown
As a group, I would say also that they need to regain positive trend momentum.
I did not go into further detail with other chart indicators but stuck to Fibonacci Analysis and Momentum of the Trend.
John Toporowski
PS – I was quite impressed with strength of the directional moves in WEED and APHA. Once they consolidated, they had strong upward power in their moves back up to re-test previous all time highs. This tells me there is a great deal of “trading interest” in these stocks.


