
Baltic Dry Index Chart Explained:
A Prelude to Increasing Commodity Demand
The Baltic Dry Index (BDI) is used to forecast the likelihood of future economic activity because it tracks the movement of bulk commodities by measuring the changes in shipping costs.
These commodities include iron ore, coal, copper, sulfur, grains, lumber, cement, and many other bulk materials used in industrial production.
A few years ago, there was a ‘re-weighting” of the BDI to reflect the volume of goods shipped on ships that vary in size. This came about after research determined that the contribution of the different vessel types could be better aligned with an index that more closely reflected it.
So what is the BDI telling us now?
Let’s check out the weekly chart and see…
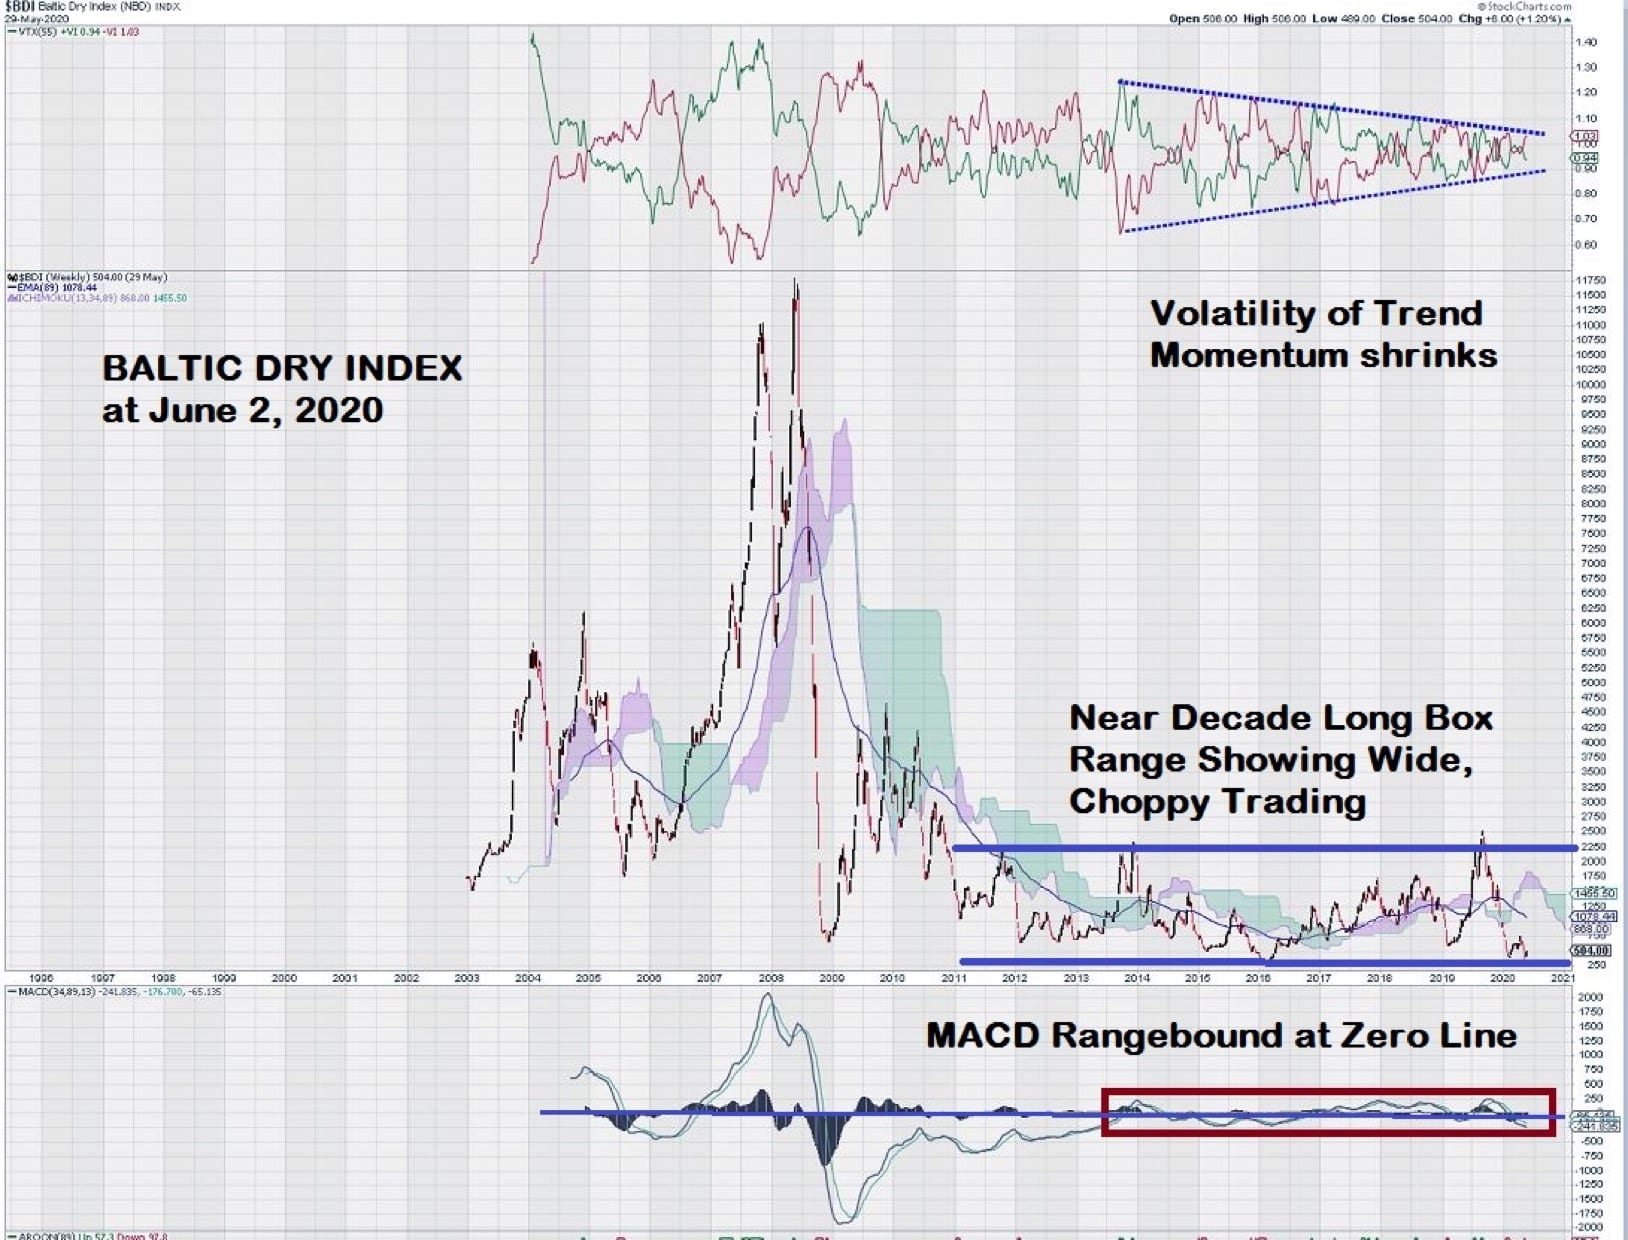
The chart clearly shows the “China Super Cycle” with the corresponding large upward spikes in 2003 – 2009. More recently, from 2011 forward to today, the BDI is showing a near decade long period of range-bound trading. This wide range varies from around 400 to 2250.
What catches our eye is the shrinking volatility in trend momentum, as measured by the Vortex Indicator (89). This steady contraction occurs even though the BDI moves from high to low within its defined trading range.
This action reminds us of how a long term Ascending Triangle Pattern consolidates price within a range before a strong breakout. During the price consolidation, volume shrinks, and some of the internal technical indicators align very well to confirm the break out when it occurs.
The current low level looks more like a base than a level from which the BDI can fall much further. MACD is negative and below the zero-line, but it too remains range-bound. Although not shown on this chart, the Commodity Channel Index (CCI) is near its lows.
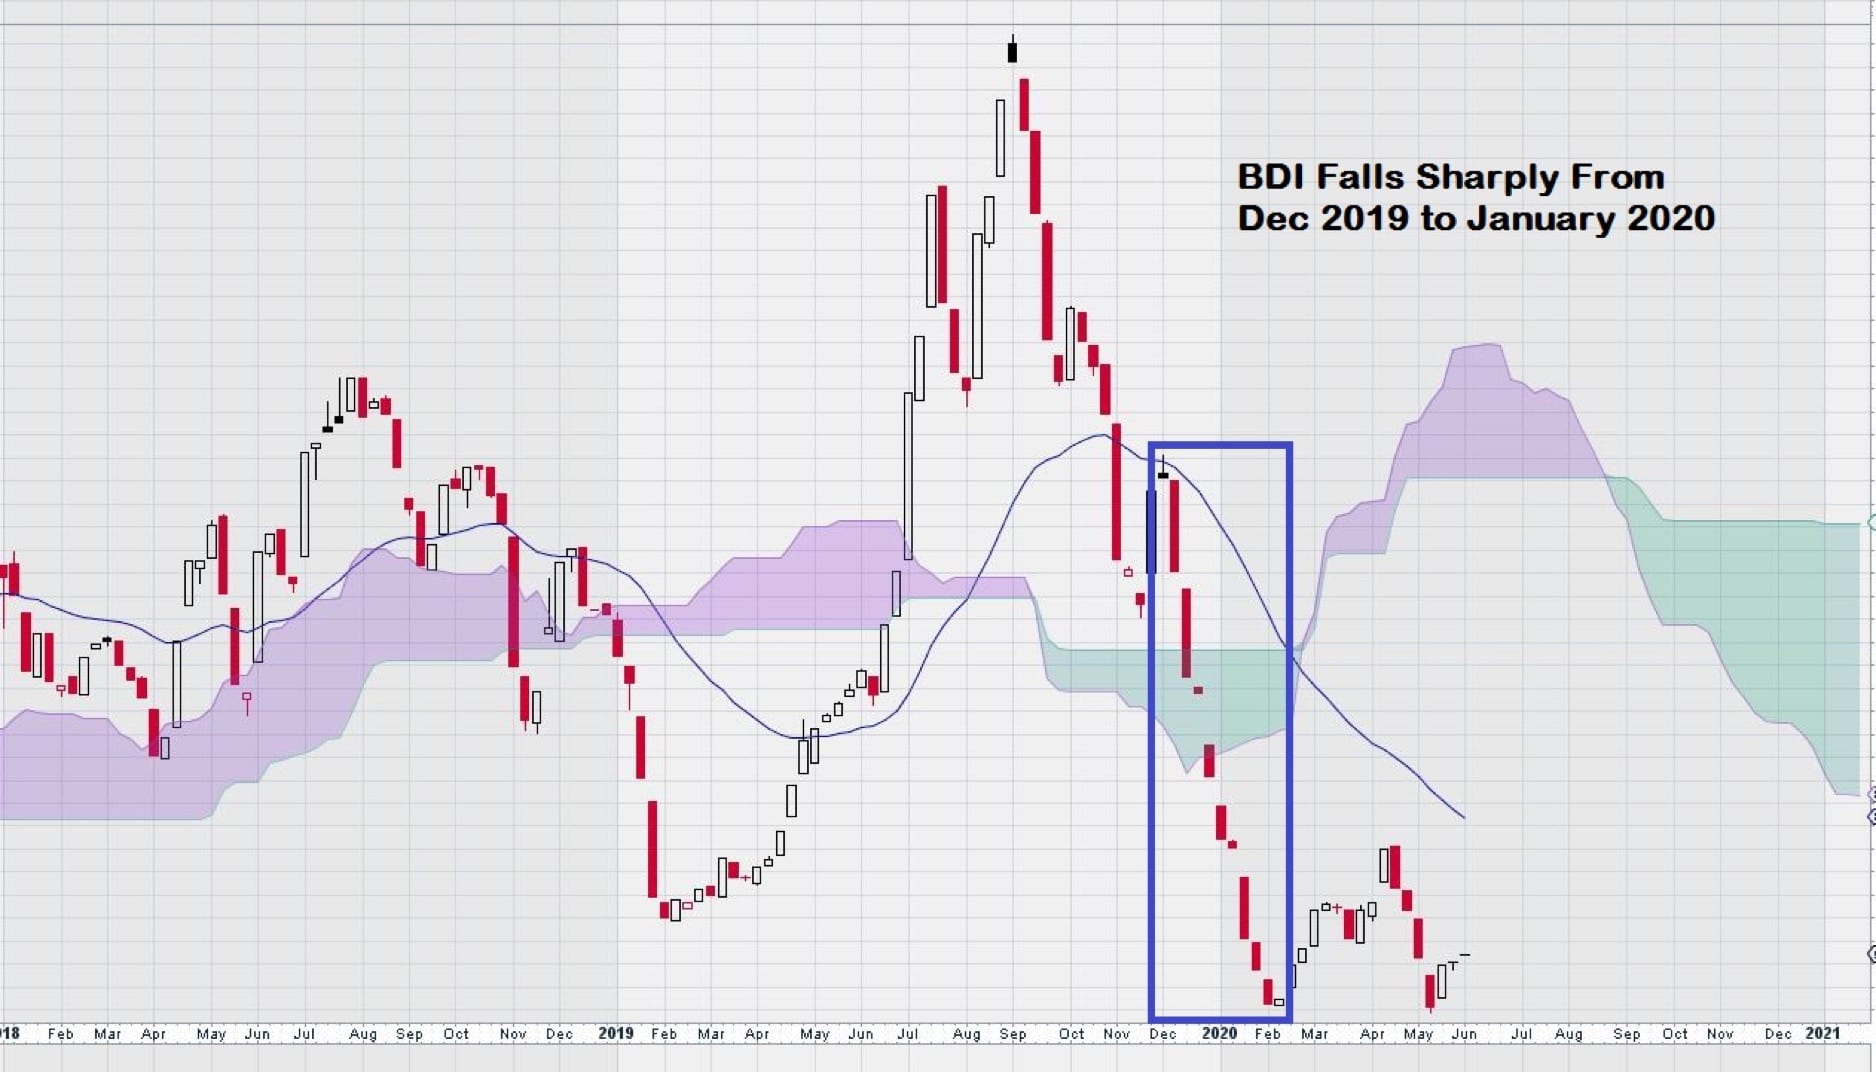
The BDI peaked in the second half of 2019 and then had a very sharp decline. One can only wonder if the early detection of the coronavirus in China didn’t have an impact on the chart. The chart completely failed in December 2019 and continued its free fall in January, before setting a base in February.
It is obvious that the world economy is facing headwinds, even as global stock markets shake off any and all negative news. Select equities continue to recover valuation lost to the impact of the worldwide coronavirus pandemic. Investors continue to have a narrow focus on technology and health care stocks.
The BDI is a proxy measure for future industrial production. The outlook for this segment of the economy is negative to neutral at best.
There is a consensus of opinion that it will be at least well into 2021 before we can get enough economic data to see if a positive trend is starting to emerge for the manufacturing sector.
Industrial production is largely predicated on consumer demand. A reliable measure of this demand needs time. Our trend momentum indicator, VTX (89), could generate an “early warning” signal of better times ahead for the BDI. Weekly charts move very slowly but can give good signals when it comes to the identification of a new trend.
We are already tracking the weekly chart for copper and have zeroed in on the True Strength Indicator as our signal to enter trades for copper stocks.
It will be interesting to see if consumers can transmit signals to the market that they are ready, able, and willing to unleash a wave of buying activity. There is much talk of “pent-up demand,” but this needs to be tempered with a roughly 40 million unemployment figure in the US.
Wanting to buy and being able to buy may be two different things…