4 Charts of the Bull That Won’t Quit

Kevin Cook goes over four charts in three minutes with a look at percentage of S&P 500 stocks above their 50-day moving average, the Russell 2000 index, and other technical indicators to predict the market’s next move.

4 Charts of the Bull That Won’t Quit

Kevin Cook goes over four charts in three minutes with a look at percentage of S&P 500 stocks above their 50-day moving average, the Russell 2000 index, and other technical indicators to predict the market’s next move.

[youtube height=”326″ width=”580″]https://www.youtube.com/watch?v=AXVuRTVcJcQ[/youtube]
Total
0
Shares
Leave a Reply

Your email address will not be published. Required fields are marked *

Prev
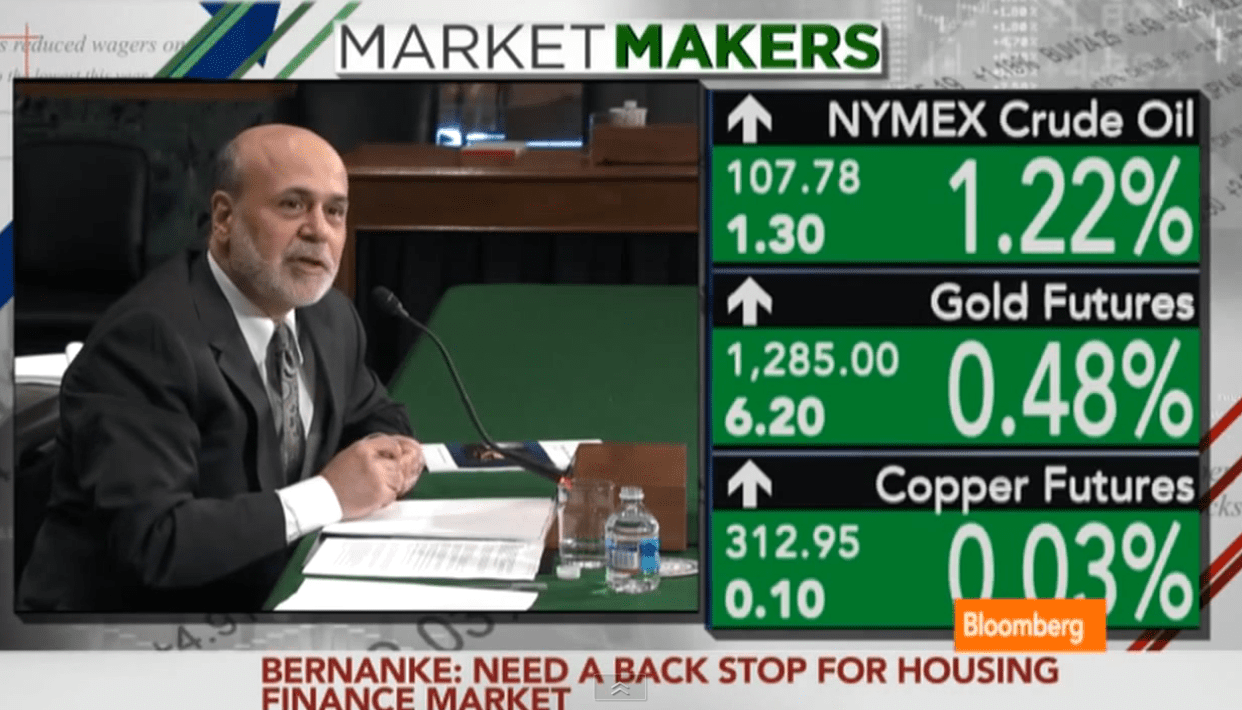
Bernanke on Gold, Again

Bernanke on Gold, Again

Federal Reserve Chairman Ben Bernanke on gold - again - in testimony Senate

Next
The 8 Biggest Municipal Bankruptcies Ever

The 8 Biggest Municipal Bankruptcies Ever

On the occasion of the city of Detroit filing for bankruptcy, a quick look at

You May Also Like