


Stocks continue to rip. AI stocks have ballooned.
And the big boys —Tesla, Meta, Google, Apple, Nvidia, and Amazon —continue to hit record highs.
While the financial bubble continues to grow, we’re all left asking: “What’s next?”
Do we continue to pour more money into these stocks, knowing that many of them are overvalued?
Well, if you’ve been a long-time reader of this newsletter, you’ll likely know our answer.
For years, since the financial bubble in 2008, we have told readers to stay in the market.
Not because we thought things were fairly valued, but because of the amount of money that has been printed by every single nation, leading to inflation that would automatically lend itself to higher share prices due to higher earnings and a lack of interest in holding cash.
It doesn’t take a genius to figure out why stock market values continue to climb. Take a look at this chart from McKinsey’s Global Private Markets Report 2025:
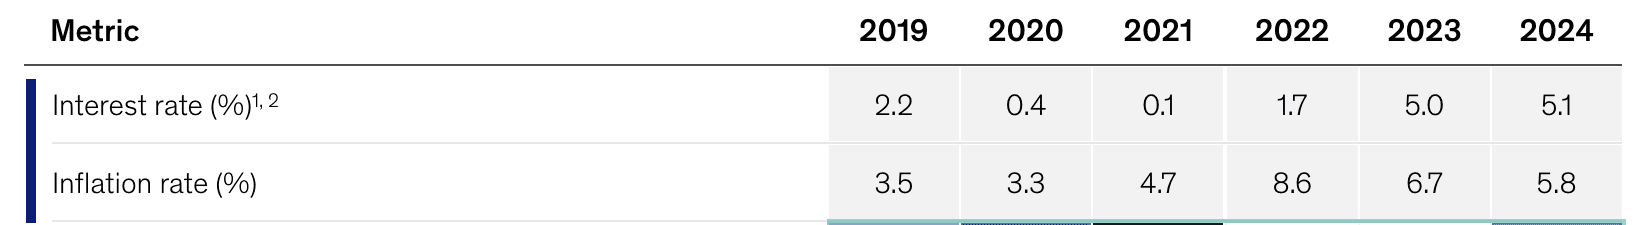
If you’ve been holding cash for the last five years, you’ve been losing money.
Let’s say you saved up $100,000 in 2019. If you did nothing with it and let it sit, you would have lost nearly $25,000 in value. If you saved up for something, like a car, that cost $100,000 in 2019, that same car could cost you $132,590 in 2024.
And even if you collected interest on that $100,000 based on the Fed rate, you would have still lost nearly $15,000 in value.
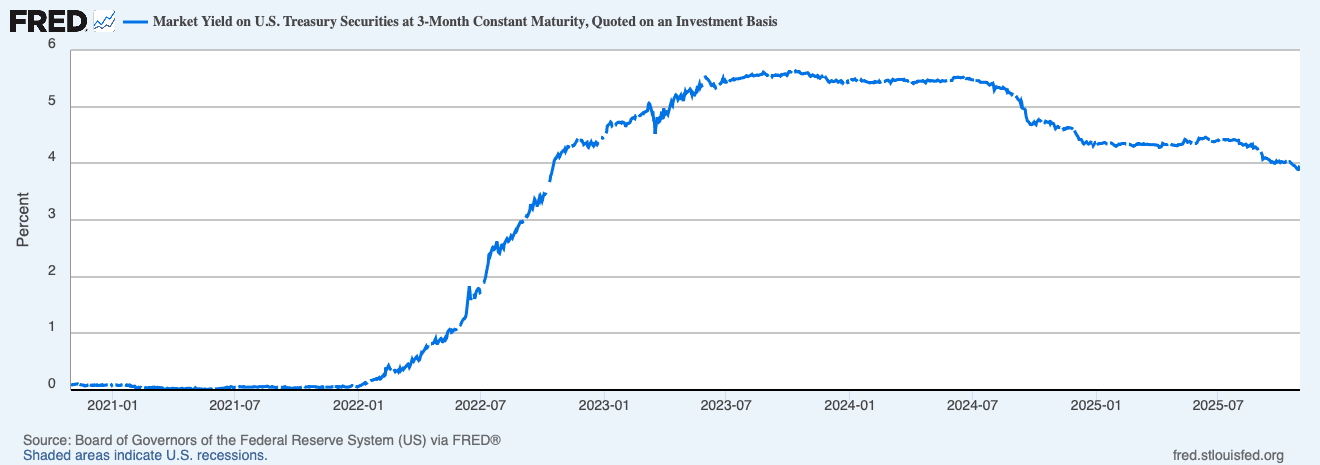
“But Treasury bills yield more,” you say.
True—3‑month T‑bills were about 3.9% on October 28. But in taxable accounts, many households’ after‑tax yield falls toward—or below—headline inflation. The result?
Still a flat or negative real return.
A Simple Return
If you simply invested in the S&P 500, you would have nearly doubled your money – significantly beating inflation and adding to your purchasing power by nearly $50,000.
That car that cost $100,000 in 2019 may cost you $132,590 today, but you can buy it and still have nearly $70,000 left over.
And I haven’t even begun to talk about what would have happened if you put your money in Bitcoin or gold.
In other words, cash has been a net loss for many years.
Now, the obvious assumption is that because cash has been such a big loser, those with cash have poured it into stocks, leading to fresh all-time highs, month after month, year after year.
As a result, there might not be much cash left to keep fueling this stock market boom.
But boy, is that wrong…
Cash on the Sidelines
The most commonly cited measure of “cash on the sidelines” in the investment world—particularly for funds and institutional investors—is the total assets under management (AUM) in U.S. money market funds (MMFs).
These funds represent highly liquid, low-risk holdings, often used as a parking spot for capital awaiting deployment into riskier assets such as stocks or bonds.
And guess what?
It’s at an all-time high.
Via PR Newswire, as reported by ICI:
“Total money market fund assets increased by $30.37 billion to $7.40 trillion for the week ended Wednesday, October 22.”
Here’s the chart from the Fed:

This isn’t just “some cash.”
It’s a proxy for uninvested cash across retail, institutional, and corporate investors.
In fact, retail MMFs alone hit nearly $3.00 trillion, while institutional MMFs were about $4.40 trillion.
In other words, there is a lot of “dry powder” left…and I mean A LOT.
The War Chest
When stocks continue to climb, it creates a compounding FOMO (fear of missing out) sentiment among those who are uninvested—even more so when inflation continues to erode the value of cash.
And since institutions are always invested, it’s important to look at the “dry powder” of households.
To do that, we can look at the Federal Reserve’s Z.1 account.
As of Q2 2025, U.S. households and nonprofits held a total of nearly $22.5 trillion in highly liquid assets – not including stocks!
Take a look:
- $4.89T in checkable deposits & currency
- $9.85T in time & savings deposits
- $0.06T in other deposits
- $4.88T in money market fund shares
- $2.82T in Treasury securities
Add in equities and other financial assets, and U.S. households hold nearly $135 trillion in financial assets. Include real estate, and that number jumps to a staggering $176.3 trillion – and that’s net worth!
Corporations Are Full
Nonfinancial corporations also carry a big buffer.
By the Fed’s “broad measure” of liquid assets—which includes currency and deposits, money fund shares, and short‑term marketable securities—U.S. corporates (not including banks) held a whopping $7.92 trillion in Q2 2025.
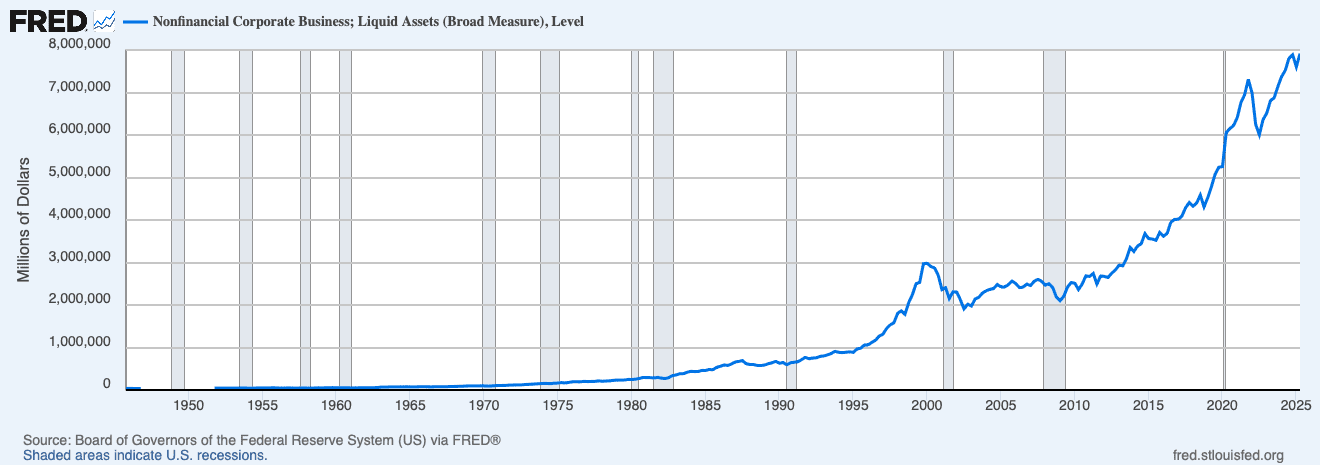
And while this cash is a buffer for corporations, remember, if there is cash and stocks drop, share buybacks are bound to happen.
Recall our newsletter from 2021, The Biggest Dealer in the World:
“Just as we saw in 2018, companies are plowing more money into buybacks than reinvesting back into the business. This year, they are on track to buy back $1 trillion worth of stock, and blow past the 2018 record.”
Add in cheap money, and it makes even more sense for corporations to borrow for ops, while using cash for share buybacks.
So, will the cheap money come?
The Fed’s New Firehose
On October 29, 2025, the Federal Reserve shifted from balance sheet contraction to balance sheet expansion.
Starting in December, the NY Fed desk will roll over Treasuries at auction and reinvest principal from agency mortgage-backed securities (MBS) into Treasury bills.
Via the Federal Reserve Bank of New York operating policy statement:
“Beginning in December, the Open Market Trading Desk (the Desk) at the Federal Reserve Bank of New York will roll over at auction all principal payments from the Federal Reserve’s holdings of Treasury securities and will reinvest all principal payments from the Federal Reserve’s holdings of agency securities into Treasury bills through secondary market purchases.”
At the same meeting, the Fed cut rates by 25 bps.
What does this all mean?
More liquidity, more cash, and more reasons not to hold it.
That’s the setup – especially if President Trump has his way.
The old adage of collecting interest in hopes of buying major dips has not held true for a long time.
Cash hasn’t been “paying to wait.”
It’s been paying to lose.
And with trillions poised in MMFs, household liquid assets, corporate balance sheets, and private commitments, the market’s next chapter won’t be written by lack of liquidity.
It’ll be written by where it finally decides to go.
And our guess is—and always has been—the financial economy.
Seek the truth and be prepared,
Carlisle Kane


u didn’t mention stablecoins, dollars that increase in value. “Dollar 2.0”