


Dear Readers,
The latest TMX Group data shows there are 1,310 mining companies listed on the TSX Venture, making up 58 percent of the entire exchange of 2,256 companies.
Reports are springing up everywhere that many of these companies, as many as 700 of them, have less than $200,000 in the bank and trade at less than 20 cents a share.
As I mentioned a couple of weeks ago, a junior on the TSX Venture spends on average around $200,000/year in legal and other fees just to comply with regulations; that doesn’t include office space, employees, general working capital, and the costs to maintain their assets.
When you factor in other costs, a junior on the TSX Venture will generally need a minimum of at least $1 million per year to operate, provided they cut back on any major drill programs or advancements to their projects.
That means a minimum of $700 million needs to be raised to keep the 700 companies on the TSX Venture alive for just one more year. That’s a lot of money.
When you consider the overall impact of the destruction of the TSX Venture, the numbers become staggering.
Of the 700 juniors that might go under, let’s say 20% of them share offices and have three employees each making $30,000/year (I am being very lean here).
Let’s say the average commercial office space is $3000/month (on the very low side). That’s a total of $1.89 million in lost office space revenue every month, and $22.68 million per year. Of course, the actual financial impact of losing 700 companies on the TSX Venture will be a lot more than this because we haven’t even begun to factor in companies that service these resource companies; put that into the equation and the numbers become staggering.
What companies will take over these empty spaces?
Perhaps the smart money is already catching on?
Take a look at these charts of Real Estate Investment Trusts (REITS) in Canada:
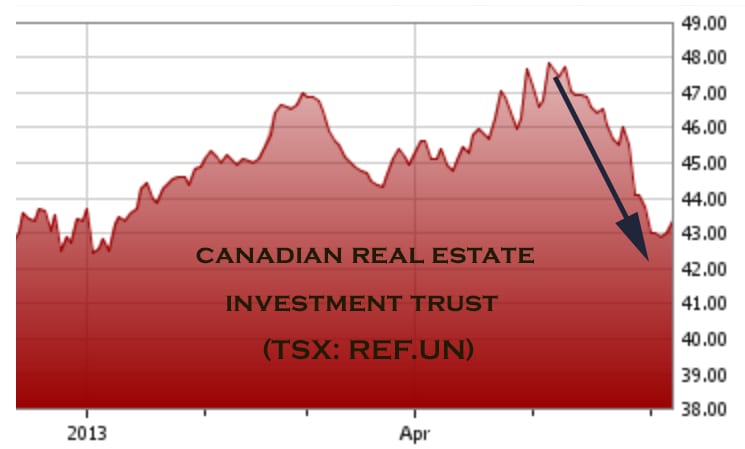
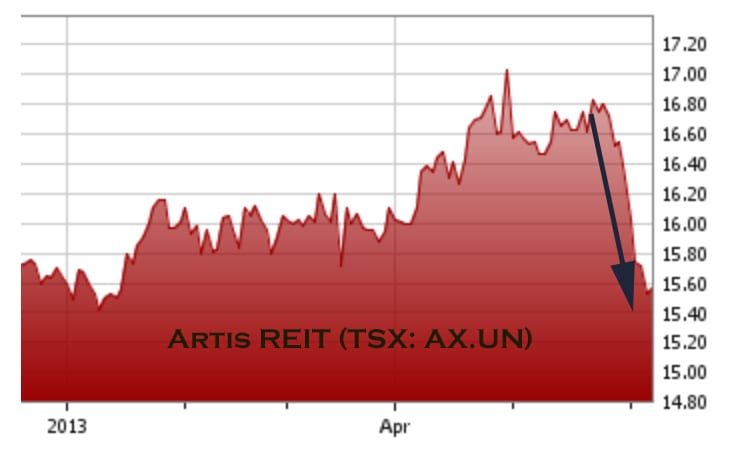
Despite Earnings Per Share growth and strong analyst sentiment, both companies are down significantly over the last month or so. While both are in oversold territory and may experience a slight rebound, perhaps the decline suggests things are looking weak?
Are the charts trying to tell us something?
What do you think? Leave a Comment by Clicking Here
Loss of Jobs
Based on our very simple example above, a bare minimum of 2100 employees will lose their jobs if the 700 TSX Venture juniors go under; that’s at least $60 million in lost revenues every year.
But this does not even come close to factoring the loss of jobs for the services sectors that service these juniors, or the brokers and small institutions that might go under as a result.
According to the Australian:
“OVER past three months the value of mining service companies has fallen by more than 35 per cent, or a massive $17 billion, in arguably the biggest single sectoral destruction of value since the dotcom crash early last decade.”
The full fiscal impact of losing these juniors will be staggering.
While it is unknown just how many jobs will be directly affected if the TSX Venture continues to fall, let’s look at the mining sector as a whole and use some comparisons to get a broader scope of the industry.
The World’s Public Mining Hubs: The TSX and the TSX Venture
The Toronto Stock Exchange (TSX) and the TSX Venture Exchange are home to 58 per cent of the world’s public mining companies
In 2011, the TSX and the TSX Venture Exchange listed over 1,600 mining companies – more than half of the world’s listed companies – with a market capitalization of $427 billion in 2011.
As at April 30, 2013, the quoted market value of both the TSX and the TSX Venture was less than $292 billion; the TSX Venture representing a dismal $13 billion of that total.
 |
|
Source: TMX Group
|
In 2012, 70% of the equity capital raised globally for mining companies was raised on TSX and the TSX Venture in 2012.
If the TSX Venture downfall trend continues, a lot stands to be lost.
Mining Jobs in Canada
In 2010, Canada’s mining sector contributed $36 billion to the national GDP and employed 308,000 workers in mineral extraction, smelting, fabrication and manufacturing.
That means one out of every 50 Canadian workers was directly employed in mining.
While Statistics Canada does not break down employment data in mining-related supporting activities (e.g. exploration, contract drilling, and transportation), the Mining Association of Canada reports that 3,223 companies supply goods and services to mining companies such as accounting, environmental consulting, legal and technical advice, and finance.
They also note that the Canadian mining industry also supports many jobs in shipping, rail and transportation. What they didn’t say was that mining accounts for more than half of Canada’s rail-freight revenues and tonnage. That means big companies such as CN Rail, CP Rail, the Port of Montreal, and the Port of Vancouver depend on a strong mining economy.
The Direct and Indirect Effects of Mining on the Economy
A 2011 analysis of the economic impacts of mining in British Columbia found that 21,112 people were employed directly in mining (2% of BC’s labor force), with an additional 16,590 jobs indirectly created.
Let’s look at Canada’s biggest mining province, Ontario:
Via the Ontario Mining Association:
“Because almost 90% of the input costs of mining operations in Ontario are sourced from within Canada, with most of those being local, and 60% of its output is exported, the mining sector is a natural multiplier of jobs. The economists who produced the recent study Mining: Dynamic and Dependable for Ontario’s Future explored, with the use of StatsCan data, some of the upstream linkages of the various inputs for mineral production in this province.
They employed this input-output model to see what impact a $1 billion increase in the value of Ontario’s mineral production, based on OMA members, would have on the economy and employment. In 2011, the value of total mineral production in Ontario was $10.7 billion.
This analysis shows that such an increase would boost Ontario’s GDP by $858 million and Canada’s GDP by $900 million. It also shows that there would be an increase in direct mine employment of 2,421 jobs. Because of the overwhelmingly domestic source of mine inputs, this leads to 1,997 direct jobs in Ontario in sectors such as wholesale trade, professional and scientific, administration, finance, construction, utilities and government. That makes for a total of 4,418 jobs.
When the induced impact of $1 billion increase in mineral sector revenues is included, the boost to the provincial GDP surpasses $1 billion for Ontario and $1.1 billion for Canada. In addition, we see 1,942 new jobs created in sectors such as retail, health care, accommodation and food services, non-profit institutions, arts and entertainment, information industries and construction. The induced jobs are derived from where and how the direct and indirect employees spend their pay cheques.
This impact is significant because as this economic study shows the average weekly wage paid in the mining industry in Ontario is 60% higher than the province’s average industrial wage. Salaries paid in the mining support sector (indirect jobs) can be higher because of specialization.
The numbers show that from $1 billion in new mineral revenue there can be generated a total of 6,360 jobs – 2,421 direct, 1,997 indirect and 1,942 induced – in Ontario. All of Canada, but predominantly Quebec and Alberta, benefit from increased mineral output in Ontario. The 2,421 direct jobs in Ontario lead to a higher total of 2,354 indirect jobs and 2,329 induced jobs across the country. The 2,421 positions in Ontario grow to 7,104 jobs in the country. This is a job multiplier of about three. Jobs equal opportunities for people of all skills and abilities.”
These numbers coincide very well with a 2010 study done by the U.S. National Mining Association showing that mining directly created 627,650 jobs and indirectly and induced* created 1,353,405 jobs.

*induced effects measure the U.S. economic impact of spending of payrolls resulting from direct and indirect activity
The spillover effect of the mining industry is even more apparent when you look elsewhere in the world. All industries create spillover effects, known as multipliers, but the mining sector generally creates a higher multiplier effect than other sectors.
For example, case studies found that for every job directly created by the Yanacocha mine in Peru, 14 jobs were indirectly created. In South Africa, while 150,000 people are directly employed in gold mining, a comparable number are employed indirectly. Each person employed in the industry may, on average, support eight dependents, which shows an extremely high multiplier effect.
The Importance of the TSX Venture
The destruction of the TSX Venture will not only affect Canada, but the rest of the world. Consider this:
In the last year (YTD April 30, 2013), the TSX Venture was responsible for raising $525,629,946 in 456 financings, while the TSX raised $989,266,371 in 60. However, the TSX Venture only has a market value of $13 billion, whereas the TSX $278 billion.
When you consider that 70% of all capital equity raised for mining was completed on the TSX and the TSX Venture in 2012, with the TSX Venture representing more than a third of that number, a further decline in the TSX Venture will be disastrous for the world mining economy.
With more regulatory changes underway, companies on TSX Venture will likely have an even harder time raising capital. If this continues, we stand to lose a lot as Canadians.
I will go over some of these regulatory changes next week.
The Equedia Letter


Why is Gran Columbia Corp stock so low look at the amount of gold they produce and at one of the lower costs?
There is statistics and there is reality. I often wonder if the people who write these articles on investing in mining companies have ever been in a mine. When I worked for INCO in the 1960s they employed 22,000 workers in Sudbury. They are now down to about 3,000. How were they able to shrink the number of employees? Through technology they made their employees many times more productive while developing cheaper extraction methods. There are real mines and there are paper mines – who are just set up to separate careless investors from their hard earned cash. I used to suckerl phone lists to these paper mining companies who survived because gullible people believed them when they said they were going to get rich off penny stocks. It has been my experience that the only ones who got rich were the promoters. Since they sell the sizzle and not the steak, these 700 paper mining companies will survive no matter what happens to commodities. That is why I would not touch a penny mining stock with a ten foot pole.
Ian, you’re right but you also forget that all mines start out the same way: from a discovery. These discoveries are made by juniors. Yes, there are scum bags, but there are also great projects that need funding.
I totally agree with Mr Ian MacDonald, and technology has replaced many workers and made a few more productive an various sectors.t
I don’t work in the industry but I invest there. I’m very disappointed in what I hear (abt TSX) and more disappointed in what I see in losses in my holdings. Makes an investor think about leaving.
…AND, it going to get worse IF my metals analyst (Larry Edelson) is correct. The next support level in gold is 1,184 and could drop to 1,028.4 before going up to $5,000+. He says that many miners will go bankrupt. Thanks for the tip on Timmins and Corvus.
Ivan is slowly elucidating the root and forward costs of what I consider a very corrupt set of acts by a small group of people. Follow the money…
The costs itemized are just the beginning. Look at what will happen over the next 17 years. From exploration to the first pay ore there is a very long interval. As the exploration gets wiped out where will the next new supply come from?
A detailed explanation of the supply/ demand metrics won’t fit in a comment. It needs to be fleshed out. In short, it’s what I refer to as compression. Yes, minerals will become so expensive that it will attract the right people who want to go explore for them but how will they be funded? Will they be employees of banks with a fixed salary? (Pay determined by the mining barons and not by success). Somehow I don’t see that ever happening.
Will the Majors take on risk and alienate their share holders who are becoming even more risk adverse? I don’t see much of that happening either. The stats on that are 1 in 1000. Not very good odds to go to your base with. This is why there is reward for real discoveries. This was what drove penny stock investors. Alas, no more.
So what happens when Highland Valley see the end of the mine date approach? Yes, they can take the equipment to Schaft Creek or Galore and help reduce their capex. Yes, the prices will support those mines and the GJ project might actually come into play.
However, look at the longer term. There’s very little to expand upon once these reach capacity. Shaft Creek and Galore represent about 50 years of mining but at a fixed rate. Western Copper might last 20 years and there are a few other mega projects that can come online. But, even if you add the top 10 projects output together you might only get enough supply to sustain 12% of the global supply.
Looking at the Chinese project and the 14 top Chilean projects all combined you can see that supply can be sustained for just long enough to meet demand but not for 20 years. After this you start going down the list of projects. (There’s a CIBC report of the main projects). Of these you will see that many are challenged. Even if all of them produce at the rate they might produce at you begin to see a fundamental problem coming. After that there are no more!
Normally, you see a list of potential projects that stand a chance of becoming a reality and of those you can discount 1/2 right off the get go. They are not just price sensitive but some are just not ever going to be mined. Water is a big issue. Not enough or too much. We all saw the big slide. Did you know that was caused by the changing weather patterns? If you think that’s going to get better… Not!
Technology is not going to save us. BHP CEO comes out and says things don’t look so bad. Really? Just how deep do you think we can go? We are going to have to get really inventive to get at some of the stuff we already know about. I bring up Schaft Creek because I know a lot about it. At 700 meters there is what appears to be another high grade deposit. Look at the width of the valley… Do they move Mount Lacasse entirely to get at it 25 years from now?
I can agree that we will bring on some advancements and probably mine the ocean too but we are going to face some serious pain in the near future. All of these will require exploration and a great deal of risk. Who will take the chance? It really comes down to this one fundamental question.
Now look at gold. The top 100 deposits with 1 million ounces or more. Have you groomed the list? Worked out the metrics of their economical attributes? I laughed recently when I heard a fellow say to another that we don’t really need gold. What a guffaw. Gold is used in all kinds of applications. Just what does he think a cranie set is made out off? If you need brain surgery do you want them going in with stainless steel?
We don’t have a replacement for gold. Equedia always talks about the safe haven gold offers and for good reason. Perhaps we need to ask ourselves why gold ever became the standard store of wealth? Was it just the beauty and luster? Something tells me it was more than just the demand of the rich that made it so. Gold was used.
Things that are used have value. The more useful the more value. Right now, the number one use is that it is real money. It is the great equalizer. You can’t inflate it and the more scare the supply becomes the more togas and camels it will buy. It has a direct relation to the physical effort that it takes to obtain it. Whether the banks like it or not, their manipulations are by definition, short lived. Manipulation has come and gone and gold is still here. It stands the test of time.
From the top 100 list you can see that it’s getting a whole lot harder to find size and grade much faster than for other metals. Will they move the glacier in our life times or do they have to wait for it to melt on its own?
I was going to write more about this on my blog but Ivan has much better access to charts and facts than I do. I hope he will cover the extended view in detail so I can expand on that on my blog with my own view point.
I do think the next letter will be an eye opener. It amazes how few investors actually know what rules were changed and what those did to the market. What I am hearing however, is that more people are getting the message. I’m beginning to hear more educated discussion about these issues and that’s a very good thing.
Keep up the good work.
Thank You,
Webs
Very very well put WEbs. Its amazing to think too that there are those who think the Venture is a bunch of crooks and no one should invest in them. Yes there are bad guys. But there are bad guys in every sector, including the banking sector. Look at the 2008 crisis. Look at subprime. All major banks – yet people still invest and put their cash with them.
Webs, you put it best the whole destruction is because of a small group of bad crooks that ruin it for every one else.
Keep up the good work we will eventually be rewarded.
Rewarded with an exchange that loses is money???
Tons of people should write to the Canadian Securities Administrators Regulatory Authorities that they are instrumental in utterly destroying the Venture Exchange by singularly looking after revolving door big Finance interests rather than Canada and the Canadian investor at large.
CSA Secretariat
Valeurs mobilières / Canadian Securities Administrators
(514) 864-9510
http://www.autorites-valeurs-mobilieres.ca
http://www.securities-administrators.ca
THe VSE could help itself too. I am tired of hearing how the VSE is suffering the biggest drought in history yet hear nothing from the players as to how they intend on fixing it. It seems they will not come up with anything that interferes with their ability to make money on insider info.
For instance. If a CEO approaches a Brokerage for money. Then the moment he approaches them they are no longer allowed to trade his stock. Why? Well the VSE Brokerages have this little collusional knack of driving a stocks price down before a PP is finalized. They do it communally by shorting the stock the moment the CEO walks through the door looking for money. The CEO goes from door to door searching. As he does, each door/brokerage then shorts or sells the stock. Then magically after the PP is priced at chump change the stock starts upward again. If the slime that calls themselves brokerages for the VSE were to clean up their act people would be more willing to part with their money for this exchange. However, this is just one example of many. Once a slime always a slime. So complain about poor conditions all you want, the fact is, until we revamp our den of thieves it goes nowhere until greed dominates the junior market again
Why does the TSX-V not address these problems? The temporary relief measures are put out there only a few months at a time when everyone else knows that this is a long term problem. The TSX-V allow you to try to market a financing at 1 or 2 cents while the upside is in a warrant that has to be 10 cents or higher after the first 12 months. Even the regular rules are out of whack. A financing at the 5 cent minimum has to have a warrant that is at a 100% premium of 10 cents even though the TSX-V rules say a warrant can be at a 50% premium to market.
Welcome to the world of regulators who has likely never worked in the capital markets or traded a stock in their lives.
The short term effect of losing exploration is one thing, but the long term cost could be in the trillions. Over regulating is probably doing more harm than good as this can will effect early exploration especially hard.
I don’t know about trillions but it will cost us a lot. How do you regulate an exchange with so many crooks, but without hurting the others?
I tried to buy Clovus Gold (CORVF) and the Brokerage House said that the stock could only be sold since June 18th
Say what? They can only sell stock? That doesn’t make any sense at all…what kind of brokerage are you using????
BAR.V down 75% from highs in January….Why?
Thanks.
Hello everyone, it’s my first pay a visit at this site, and post is really fruitful in
favor of me, keep up posting these types of articles or reviews.
http://www.microsharpsolar.com – solar panel cost and output – solar panel cost
Why users still make use of to read news papers when in this technological world all is available on web?
Wonderful beat ! I wish to apprentice while you amend your website, how could i
subscribe for a weblog site? The account helped me a
acceptable deal. I have been a little bit acquainted of this your broadcast provided bright transparent concept
Excellent post. I was checking constantly this blog and
I’m impressed! Very helpful info specifically the last part 🙂 I care for such info much.
I was seeking this certain info for a very long time.
Thank you and best of luck.
Thanks for the tips about credit repair on this amazing web-site.
Some tips i would offer as advice to people will be to
give up the actual mentality that they may buy now and fork out
later. Like a society we tend to repeat this for many factors.
This includes family vacations, furniture, along
with items we really want to have. However, it is advisable to separate a person’s wants from the needs.
If you are working to improve your credit rating score you
have to make some trade-offs. For example you are able to shop online
to save cash or you can go to second hand
merchants instead of costly department stores with regard to clothing.
Hmm is anyone else experiencing problems with the pictures on this blog loading?
I’m trying to figure out if its a problem on my end or if it’s
the blog. Any suggestions would be greatly appreciated.
Yoou rezlly make it sedem so easy with yor presentation but I ind this tpic to be really somethkng thgat
I thin I would never understand. It seems tooo complexx annd extremely broad for
me. I amm looking forward for you nextt post, I’ll try to get thhe hamg of it!
griseofulvin psoriasis gebabdkggfba
In fact social networks have revolutionized our lives by incorporating all the basic elements of a person’s social life in one place.
If you like something from other people’s board
you can “re-pin” it to your own. The “following” and “followers” selection operates in the
same fashion as Google+ and Twitter.