
In today’s “Single Best Chart,” Bloomberg’s Scarlet Fu displays the slow move out of U.S. Treasuries by the Chinese government. She speaks on Bloomberg Television’s “Bloomberg Surveillance.”
%CODE66%

In today's "Single Best Chart," Bloomberg's Scarlet Fu displays the slow move out of U.S. Treasuries by the Chinese government.
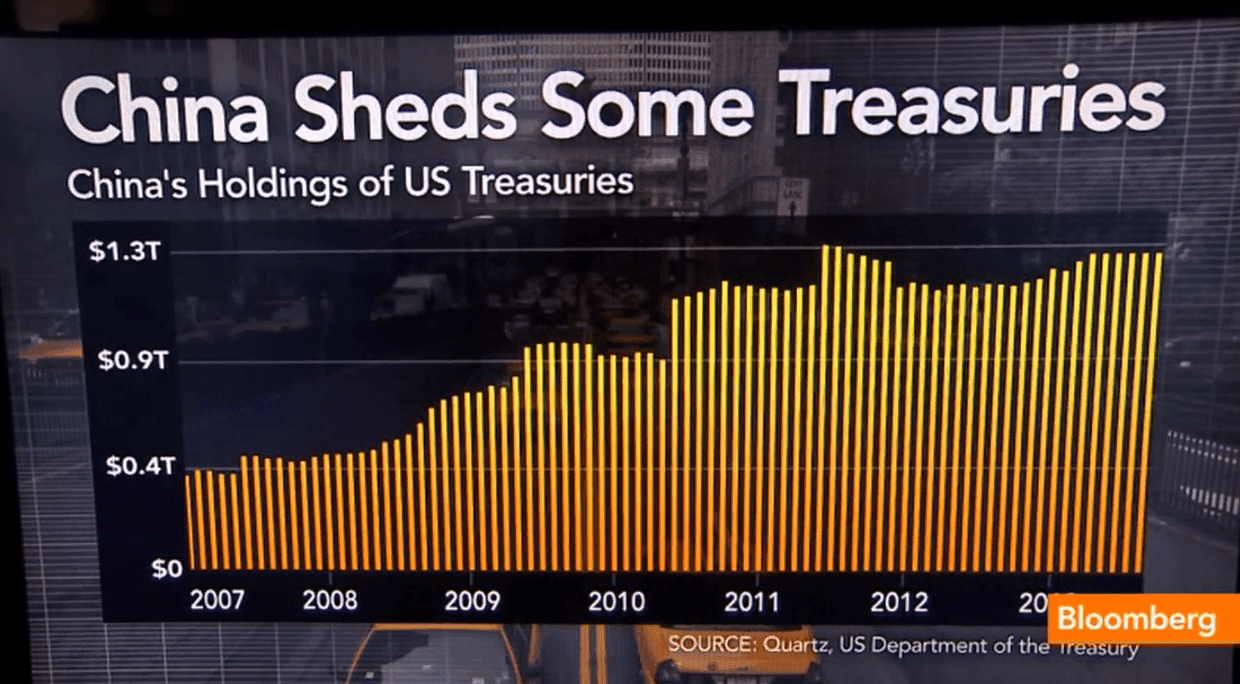
In today’s “Single Best Chart,” Bloomberg’s Scarlet Fu displays the slow move out of U.S. Treasuries by the Chinese government. She speaks on Bloomberg Television’s “Bloomberg Surveillance.”
%CODE66%

Subscribe to our FREE monthly newsletter and see how many of our readers have made thousands in PROFITS with our ideas
Gulf-to-China tanker rates have topped $1 million a day. The cost of crossing Hormuz reveals what crude prices miss, and what investors in tanker stocks stand to gain or lose.
U.S. household wealth has reached $195.9 trillion, surpassing its 2022 peak relative to income. What could higher rates mean for stocks, bonds and your portfolio?
Trump’s three-day tariff pause reduces immediate trade risk, but the bigger energy story is renewed political support for Canadian pipeline capacity. Here are the oil and infrastructure stocks with the clearest exposure—and the risks investors should not ignore.
Learn what's next for the stock market as inflation influences stock valuations and top companies soar to record levels.
Explore what just happened to Charlie Kirk and how it reveals the deeper issues of division and power struggles in society.
Dive into the perspective of the Establishment and gain a deeper understanding of the forces behind Trump's rise to power. Then prepare for what's next.